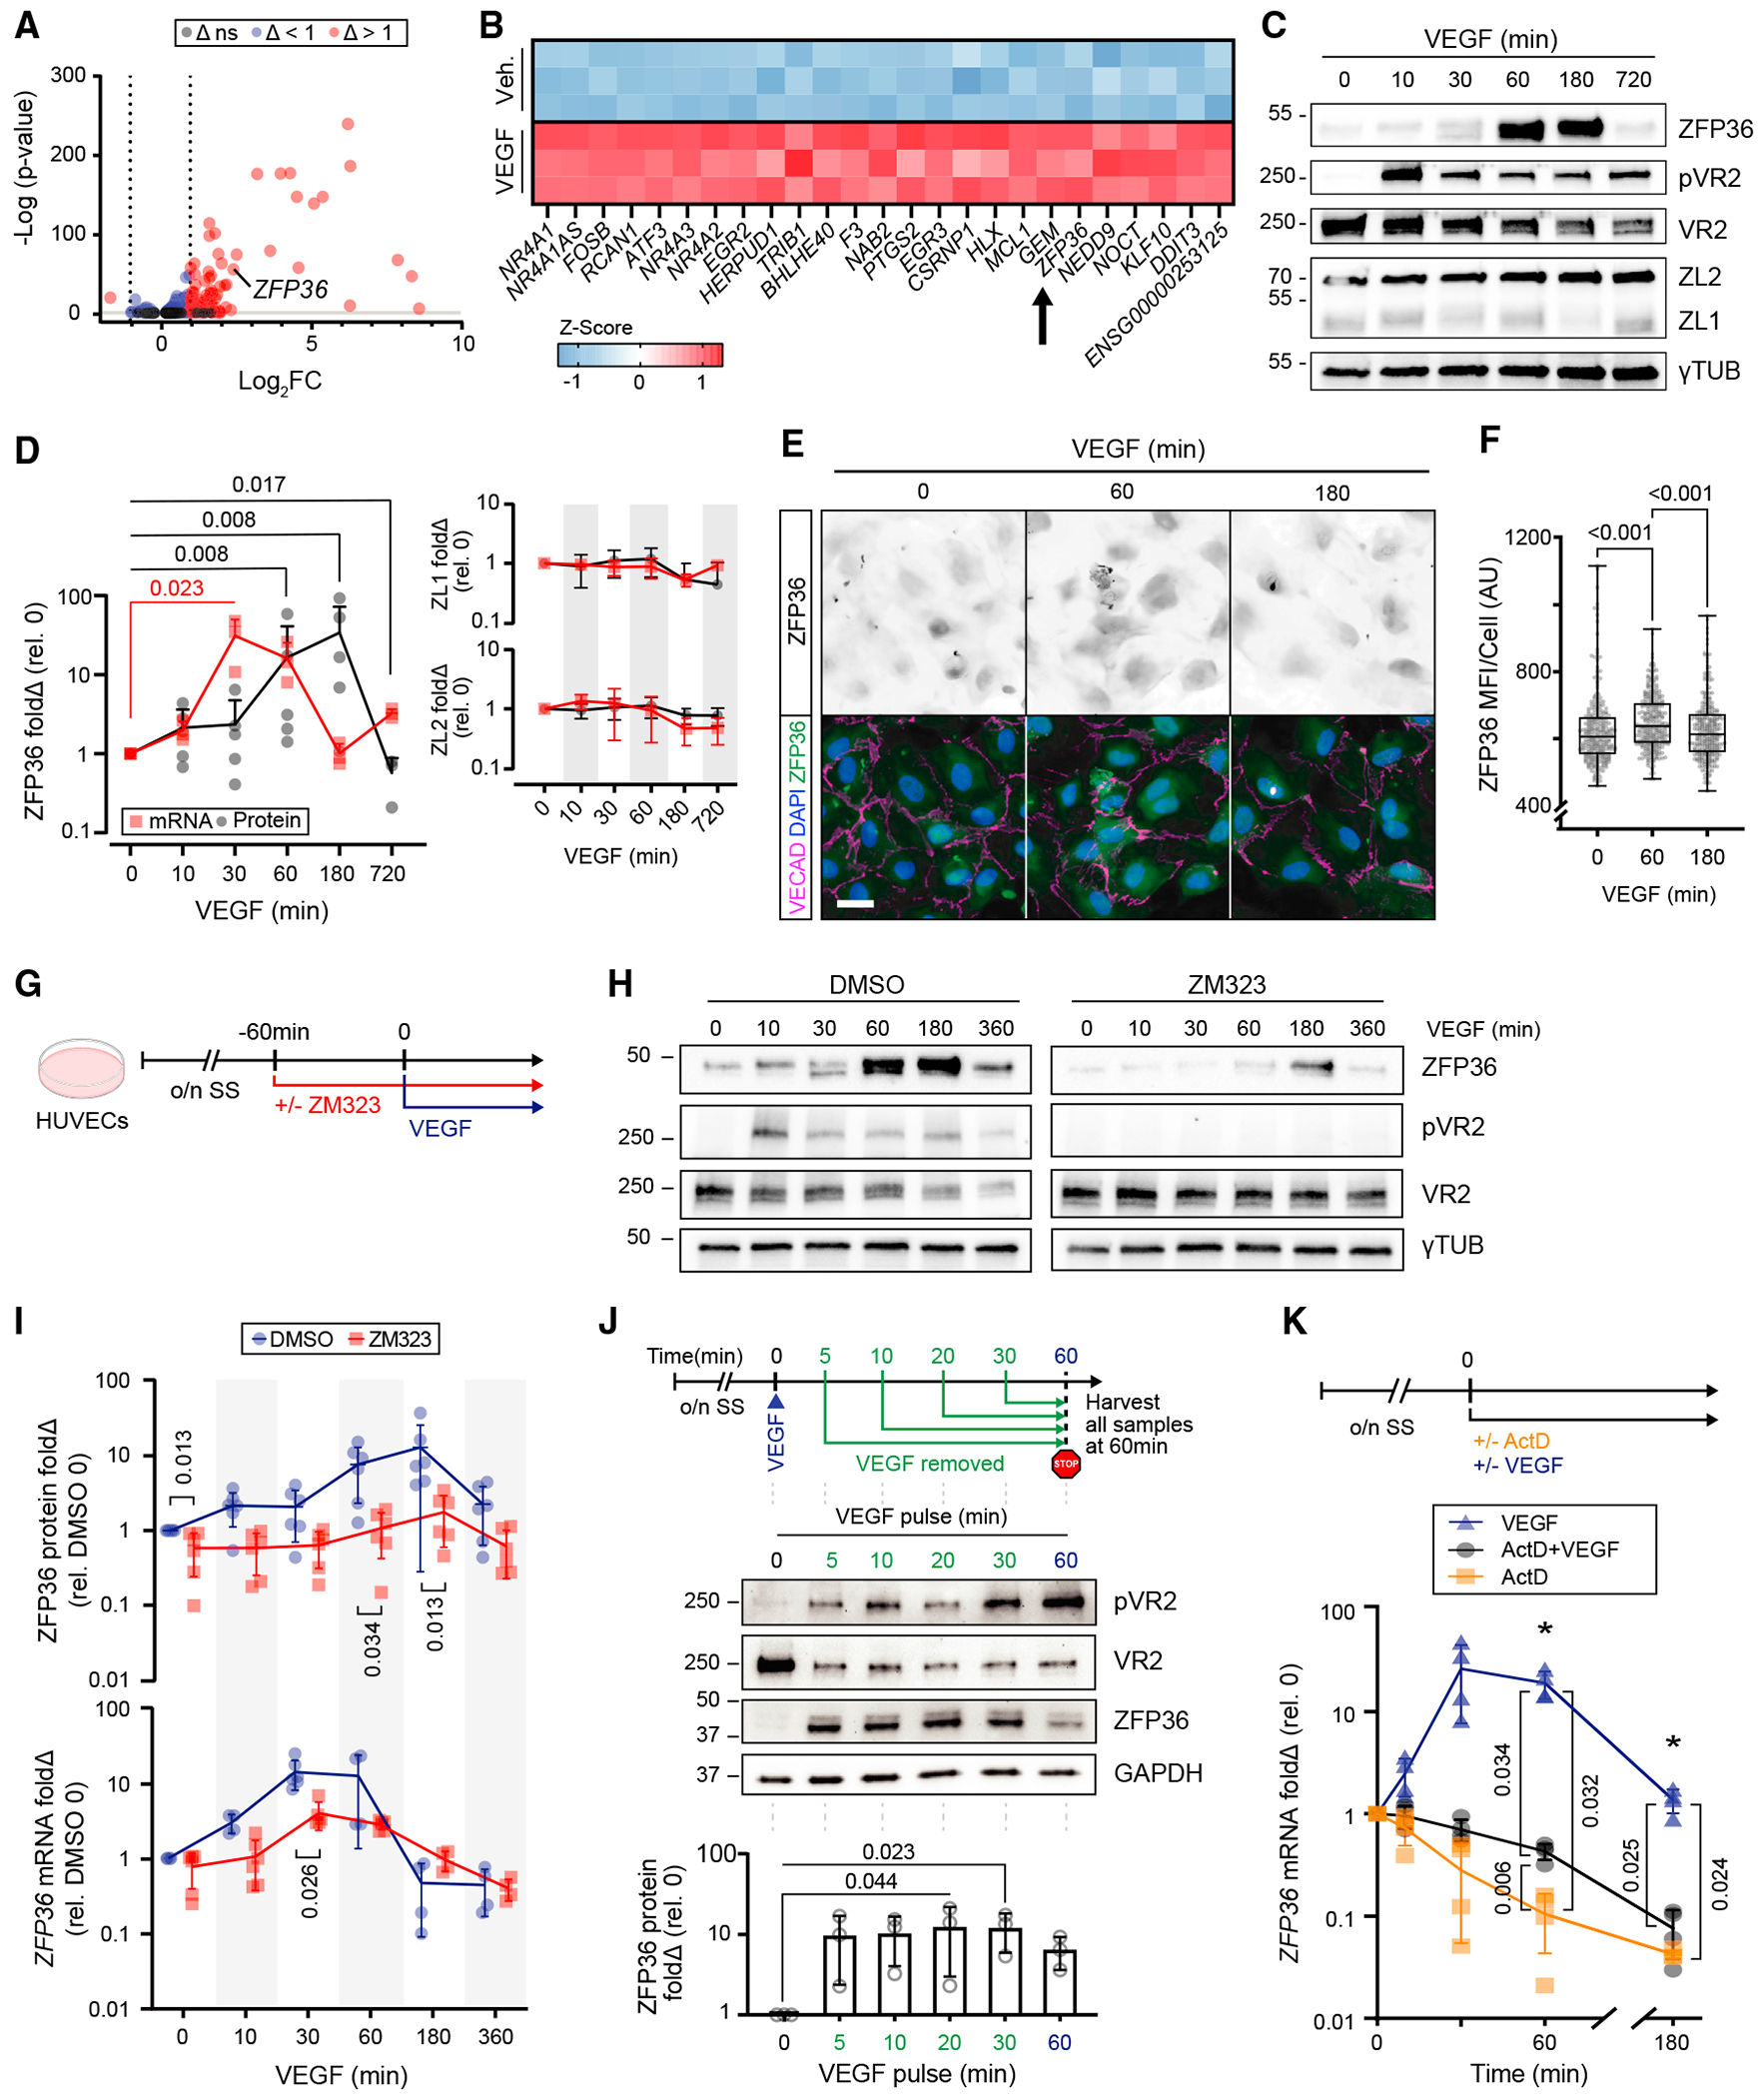
Figure 1. VEGF triggers a robust induction of ZFP36 in ECs.

(A) Volcano plot of RNA-seq differential expression log2fold change (Δ) of HUVECs with or without VEGF for 1 h. Non-significant (ns) cutoff was set to −ILog(p) > 2.
(B) Z score heatmap of the top 25 differentially expressed genes after exposure to vehicle (control [Ctrl]) or VEGF165 (100 ng/mL) for 1 h (n = 3 biological replicates).
(C) Representative immunoblots of ZFP36, phospho-VEGFR2 (pVR2), VEGFR2 (VR2), ZFP36L1 (ZL1), ZFP36L2 (ZL2), and γ-tubulin (γTUB) from HUVEC lysates after VEGF stimulation for the indicated times.
(D) Immunoblot quantification of fold change (Δ) relative to control (n = 5 biological replicates; except t = 720, n = 3 biological replicates) and RT-qPCR transcripts of ZFP36, ZL1, and ZL2 (n = 3 biological replicates). Data for ZFP36 are individual replicates with a line representing mean. Data for ZL1 and ZL2 are represented with mean ± SD. Statistical analysis by Mann-Whitney test.
(E) Representative immunofluorescence of ZFP36, VE-cadherin (VECAD), and DAPI on HUVECs treated with or without VEGF at the indicated times (scale bar, 25 μm).
(F) Quantification of ZFP36 mean fluorescence intensity (MFI) per cell (n = 300 cells). Data are presented as individual replicates, with the overlaid box extending from the 25th to 75th percentiles with whiskers showing minimum and maximum values. Statistics: Kruskal-Wallis with post-hoc Dunn’s multiple-comparisons test.
(G) Experimental design. Confluent HUVEC monolayers were exposed to the VR2 inhibitor ZM323881 (ZM323) or vehicle for 1 h following overnight serum starvation (o/n SS), followed by VEGF165 stimulation.
(H) Representative immunoblots of ZFP36, pVR2, VR2, and γTUB from HUVECs treated with VEGF at the indicated times in the presence of DMSO (vehicle control) or ZM323 (VEGFR2 inhibitor).
(I) Graph representing protein levels (n = 5 biological replicates) and RT-qPCR transcripts (n = 4–6, combination of technical replicates with a minimum of 3 biological replicates) for ZFP36 after VEGF time course in the presence or absence of ZM323. Data presented are mean from biological replicates ± SD. Statistics: multiple Mann-Whitney tests with Holm-Šídák method to adjust for multiple comparisons.
(J) Experimental design of pulse-chase VEGF treatment with associated representative WB and quantification. WB quantification is presented with individual replicates and mean ± SD relative to control (n = 3 biological replicates). Statistics: Freidman’s test with post-hoc Dunn’s multiple-comparisons test.
(K) Experimental design of actinomycin D (ActD) treatment and qPCR quantification of mRNA normalized to hprt (n = 4 biological replicates) mean fold change ± SD relative to control. Kruskal-Wallis with post-hoc Dunn’s multiple-comparisons test.
