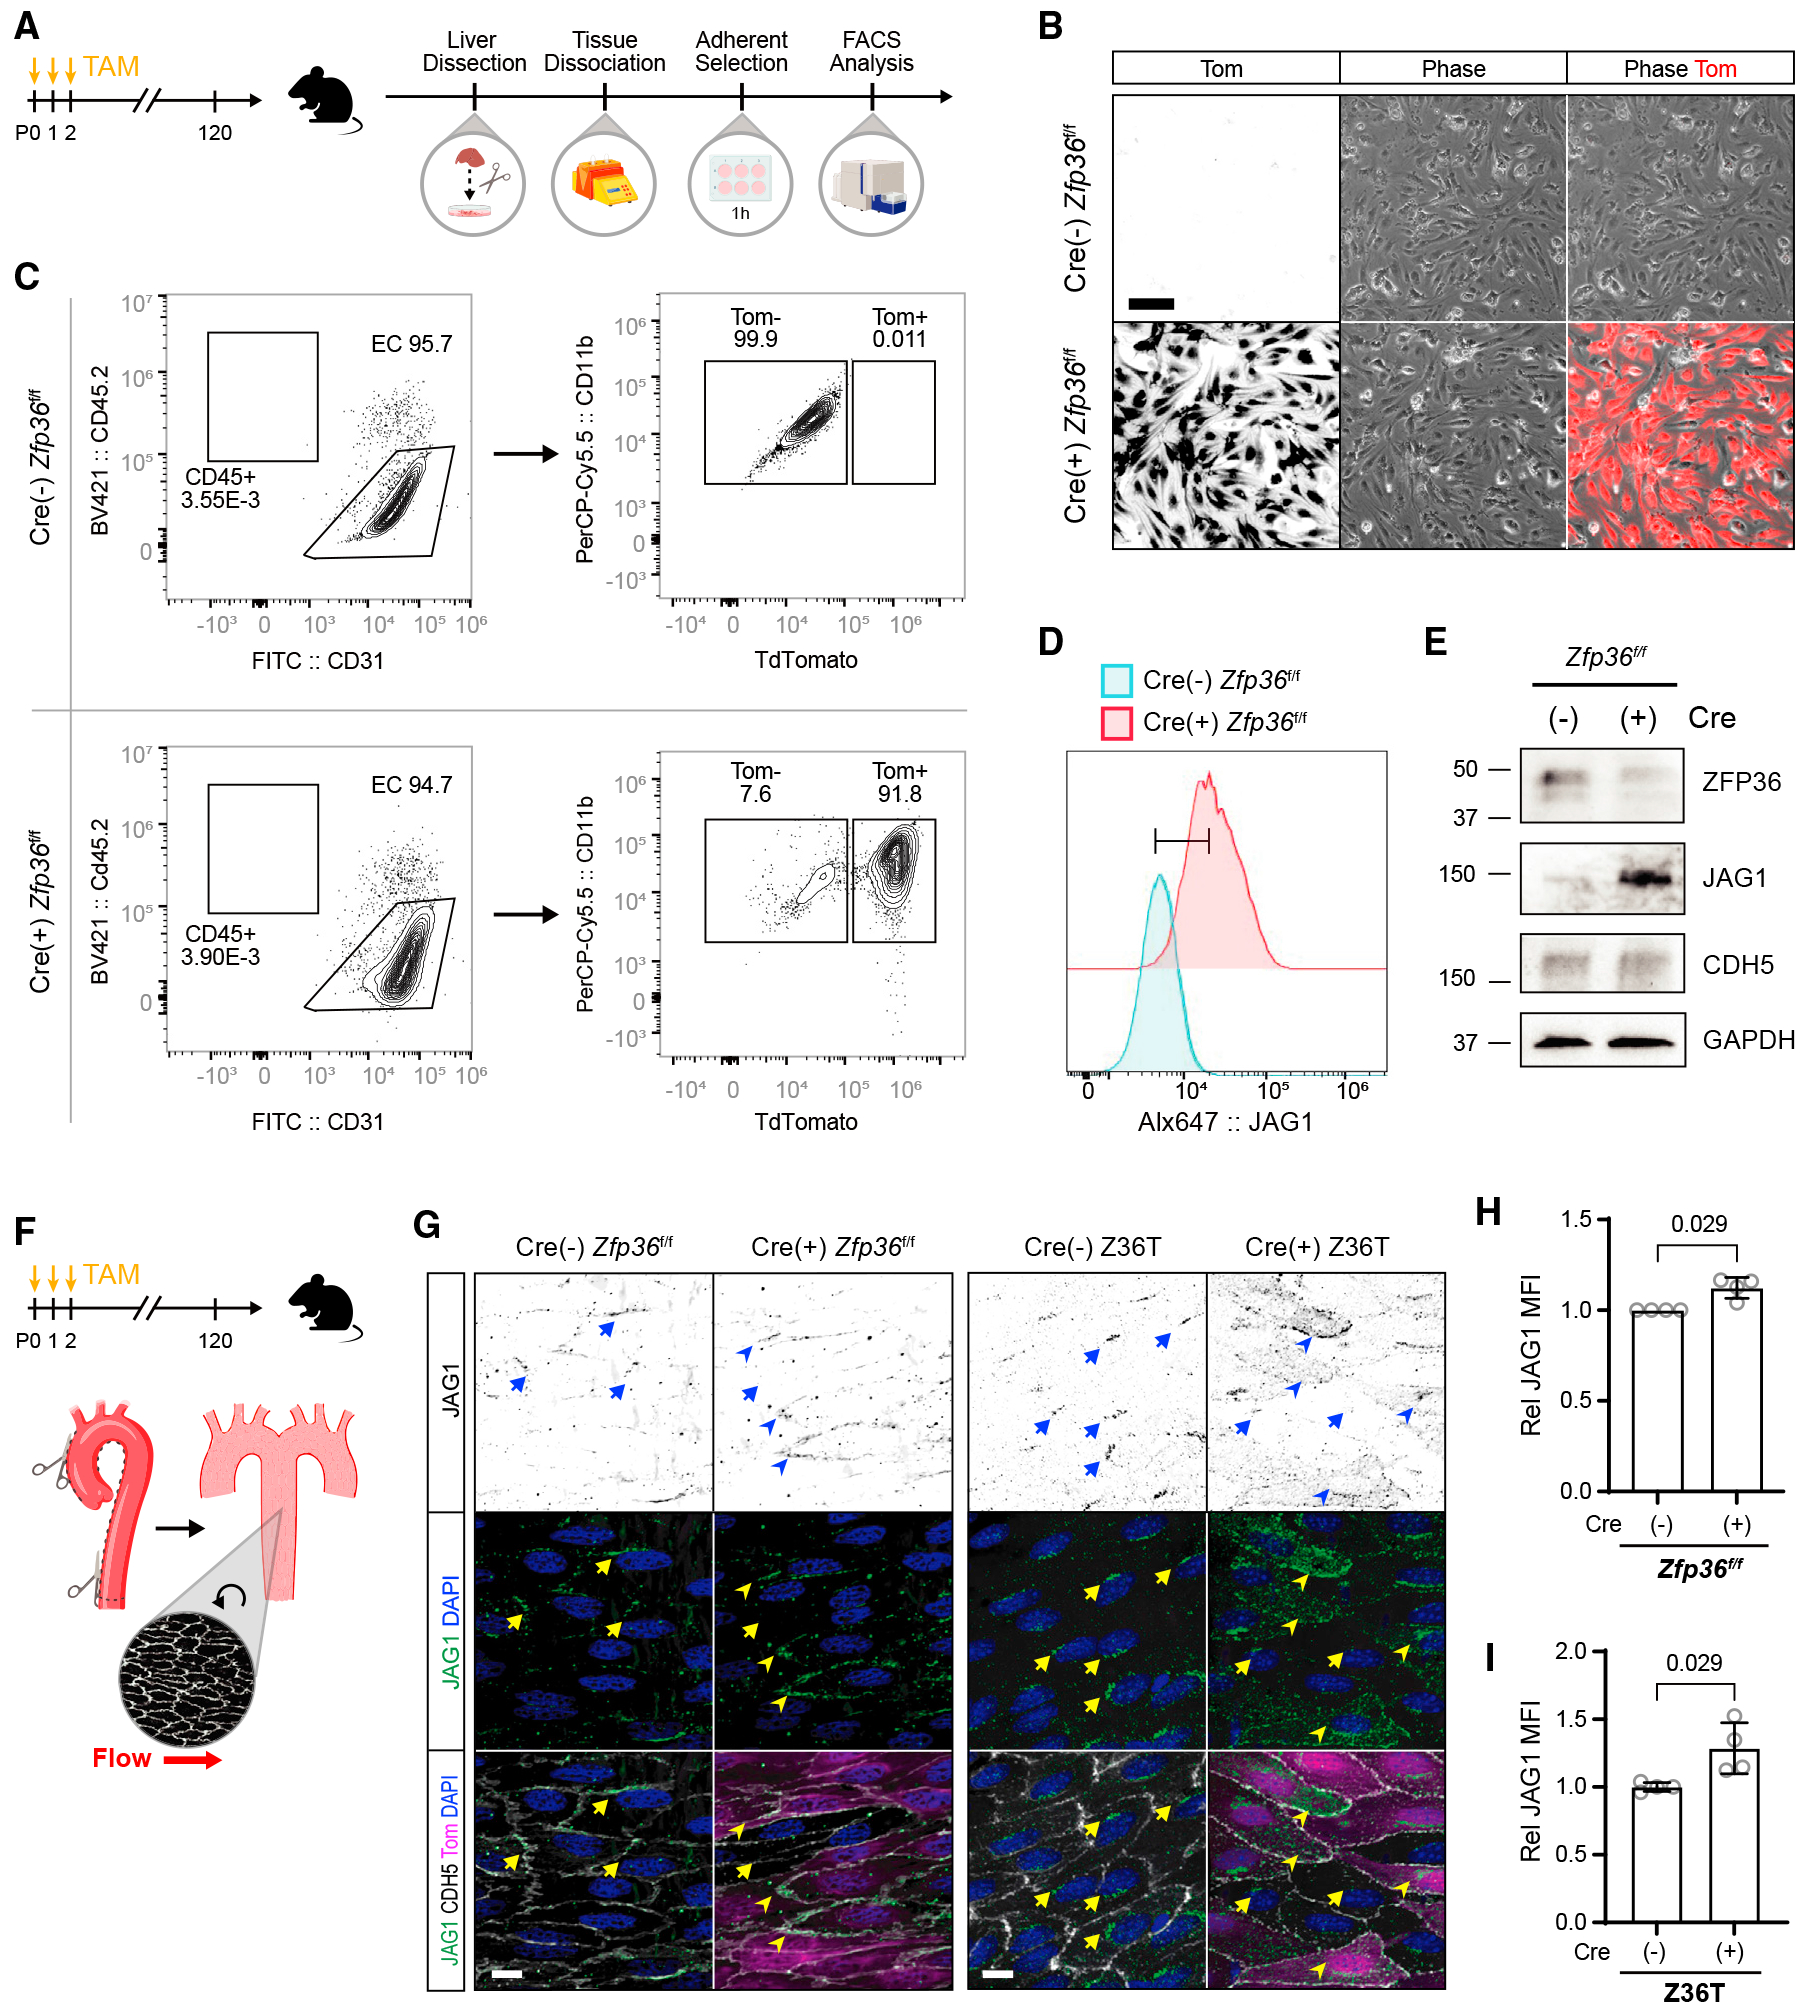
Figure 4. Deletion of zfp36 in the endothelium increases Jag1 expression in vivo.

(A) Experimental design for isolation of ECs from tamoxifen-fed inducible Cdh5-Cre Z fp36f/f TdTomato (Tom) reporter mice.
(B) Representative Tom fluorescence and phase images from selected liver ECs in culture (scale bar, 100 μm). The first column shows the monochromatic conversion of the last column.
(C) Flow cytometry gating strategy and analysis of liver ECs.
(D) Flow cytometry analysis of surface Jag1 expression from Cre(−),Tom(−) ECs and Cre(+),Tom(+) ECs gated from the experiment shown in (C). The y axis represents normalized (relative to mode) cell numbers.
(E) Immunoblot of Zfp36, Jag1, VECAD, and GAPDH from EC lysates.
(F) Schematic of aortic dissection for en face immunohistochemistry.
(G) Representative immunohistochemistry of JAG1, VECAD, and DAPI from tamoxifen (TAM)-fed Cdh5-Cre zfp36f/f Tom mice and from Cdh5-Cre triple zfp36f/f/1f/f/2f/f (Z36T) Tom mice, as indicated (scale bars, 10 μm). A Tom signal indicates recombination of the reporter in the respective cells. Several areas of positive fluorescent signal are marked on Tom(−) (arrows) and Tom(+) (arrowheads) cells. The first row shows monochromatic view of the green (JAG1) channel.
(H) Quantification of Jag1 MFI ± SD from TAM-fed Cdh5-Crezfp36f/f Tom mice, averaged from a minimum of 2 fields of view per animal (n = 4). For Cre(+) animals, only Tom(+) cell areas were measured. Statistics: Mann-Whitney test.
(I) Quantification of JAG1 MFI ± SD from TAM-fed Cdh5-Cre triple zfp36f/fl1f/fl2f/f (Z36T) Tom mice, averaged from a minimum of 2 fields of view per animal (n = 4). For Cre(+) animals, only Tom(+) cell areas were measured. Statistics: Mann-Whitney test.
