
Figure 7. Increased tip cells and delayed retinal angiogenesis from endothelial Zfp36 KO is rescued by Jag1 haploinsufficiency.
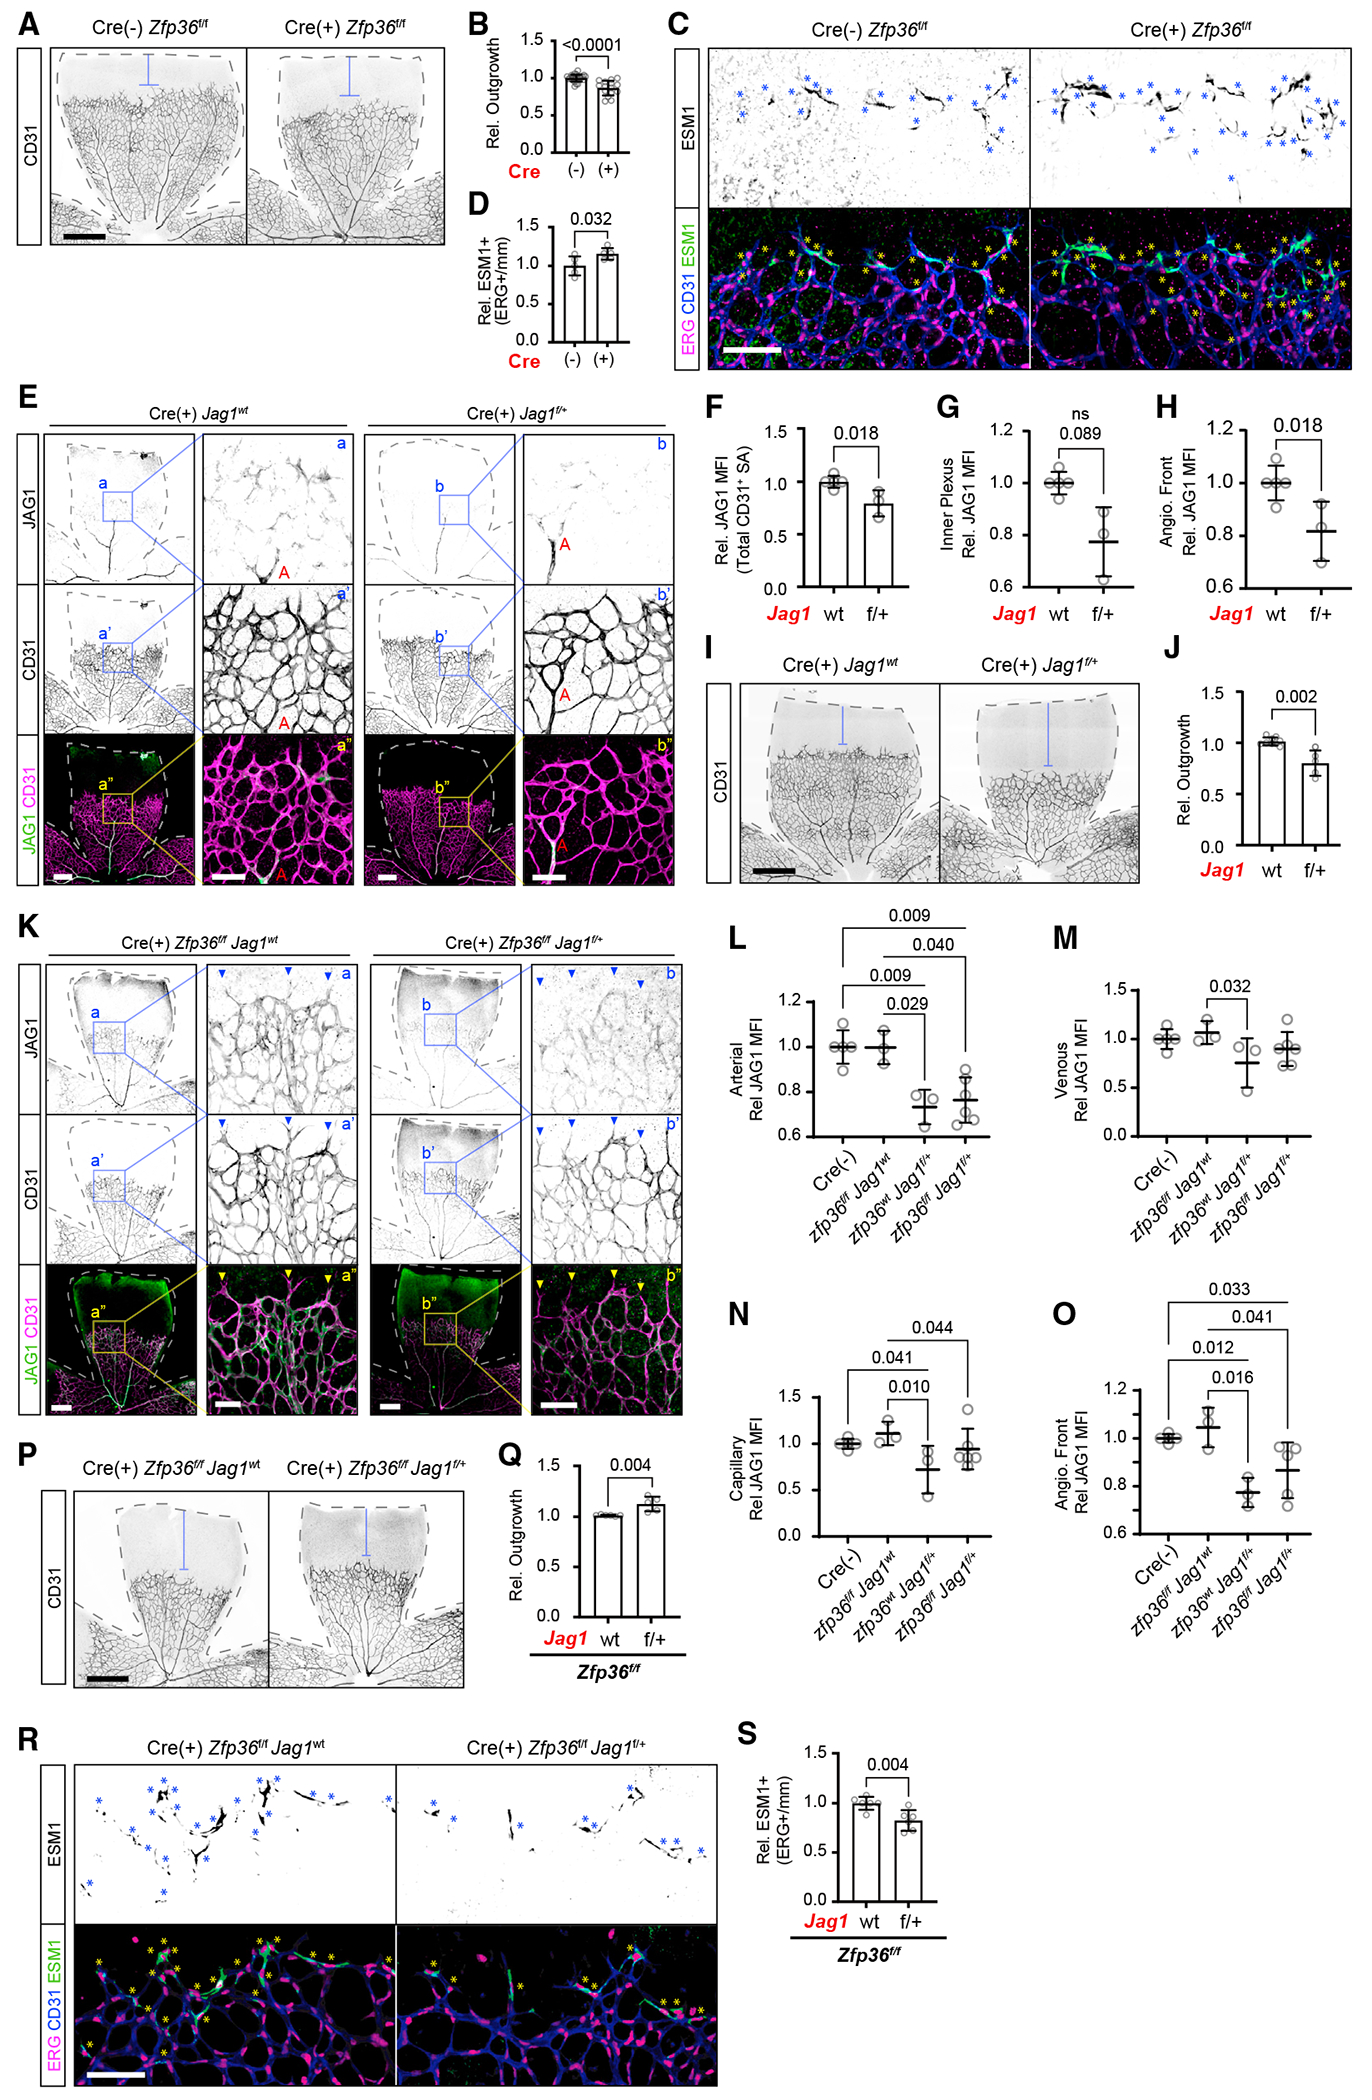
(A) Representative CD31 immunohistochemistry of TAM-fed inducible Cdh5-Cre Zfp36f/f mice. Dashed lines outline the retina area, and blue brackets indicate angiogenic outgrowth based on remaining retina area (scale bar, 500 μm).
(B) Quantification of outgrowth (CD31+ area/total area) averaged per animal of TAM-fed inducible Cdh5-Cre Zfp36f/f mouse retina relative to average littermate control (mean ± SD; n = 22 Cre(–) Zfp36f/f and 15 Cre(+) Zfp36f/f, derived from >3 independent litters). Statistics: Mann-Whitney test.
(C) Representative CD31, Esm1, and Erg immunohistochemistry of TAM-fed inducible Cdh5-Cre Zfp36f/f mice. Asterisks indicate Esm1+ Erg (scale bar, 100 μm).
(D) Quantification of Esm1+ Erg normalized to the width of the angiogenic front (mm) of TAM-fed inducible Cdh5-Cre Zfp36f/f mice relative to average littermate control (mean ± SD; n = 5 replicates each derived from 3 independent litters). Statistics: Mann-Whitney test.
(E) Representative JAG1 and CD31 immunohistochemistry of TAM-fed inducible CDH5-Cre(+) Jag1wt and Jag1f/+ mice. Dashed lines outline the retina area with the artery (A) labeled (low-magnification scale bar, 300 μm; higher-magnification scale bar, 100 μm).
(F–H) Quantification of JAG1 MFI ± SD within total CD31+ SA (F), inner plexus (G), and angiogenic front (H) in TAM-fed inducible CDH5-Cre(+) Jag1wt and Jag1f/+ mice (mean ± SD, n = 5 and 3, respectively). Statistics: Mann-Whitney test.
(I) Representative CD31 immunohistochemistry of TAM-fed inducible CDH5-Cre(+) Jag1wt and Jag1f/+ mice. Dashed lines outline the retina area, and blue brackets indicate angiogenic outgrowth based on remaining retina area (scale bar, 300 μm).
(J) Quantification of outgrowth (CD31+ area/total area) per retina of TAM-fed inducible CDH5-Cre(+) Jag1wt and Jag1f/+ mice (mean ± SD, n = 5 and 3, respectively). Statistics: Mann-Whitney test.
(K) Representative JAG1 and CD31 IHC of TAM-fed inducible CDH5-Cre(+) Zfp36f/f mice with either Jag1wt or Jag1f/+ alleles. Dashed lines outline the retina area (low-magnification scale bar, 300 μm; higher-magnification scale bar, 100 μm).
(L–O) Quantification of JAG1 MFI ± SD within CD31+ SA, subdivided by specific arterial (L), venous (M), or capillary (N) regions from the inner plexus in addition to the angiogenic front (O) in TAM-fed inducible CDH5-Cre(+) Zfp36f/fJag1wt, Zfp36wtJag1f/+, and Zfp36f/fJag1f/+ mice relative to littermate Cre(–) controls (n = 3, 3, 5, and 5 animals, respectively, derived from 4 independent litters). Statistics: Mann-Whitney test and Kruskal-Wallis with post hoc uncorrected Dunn’s test.
(P) Representative CD31 immunohistochemistry of TAM-fed inducible Cdh5-Cre(+) Zfp36f/f mice with either Jag1wt or Jag1f/+ alleles. Dashed lines outline the retina area, and blue brackets indicate angiogenic outgrowth based on remaining retina area (scale bar, 500 μm).
(Q) Quantification of outgrowth (CD31+ area/total area) averaged per animal of TAM-fed inducible Cdh5-Cre Zfp36f/f mice with either Jag1wt or Jag1f/+ retina relative to average littermate control (mean ± SD; n = 6 Jag1wt and 5 Jag1f/+; derived from 4 independent litters). Statistics: Mann-Whitney test.
(R) Representative CD31, Esm1, and Erg immunohistochemistry of TAM-fed inducible Cdh5-Cre(+) Zfp36f/f mice with either Jag1wt or Jag1f/+ alleles. Asterisks indicate Esm1+ Erg (scale bars, 100 μm).
(S) Quantification of Esm1+ Erg of TAM-fed inducible Cdh5-Cre Zfp36f/f mouse retina with either Jag1wt or Jag1f/+ alleles normalized to the width of the angiogenic front (mm) relative to average littermate control (mean ± SD; n = 7 replicates each, derived from 4 independent litters). Statistics: Mann-Whitney test.