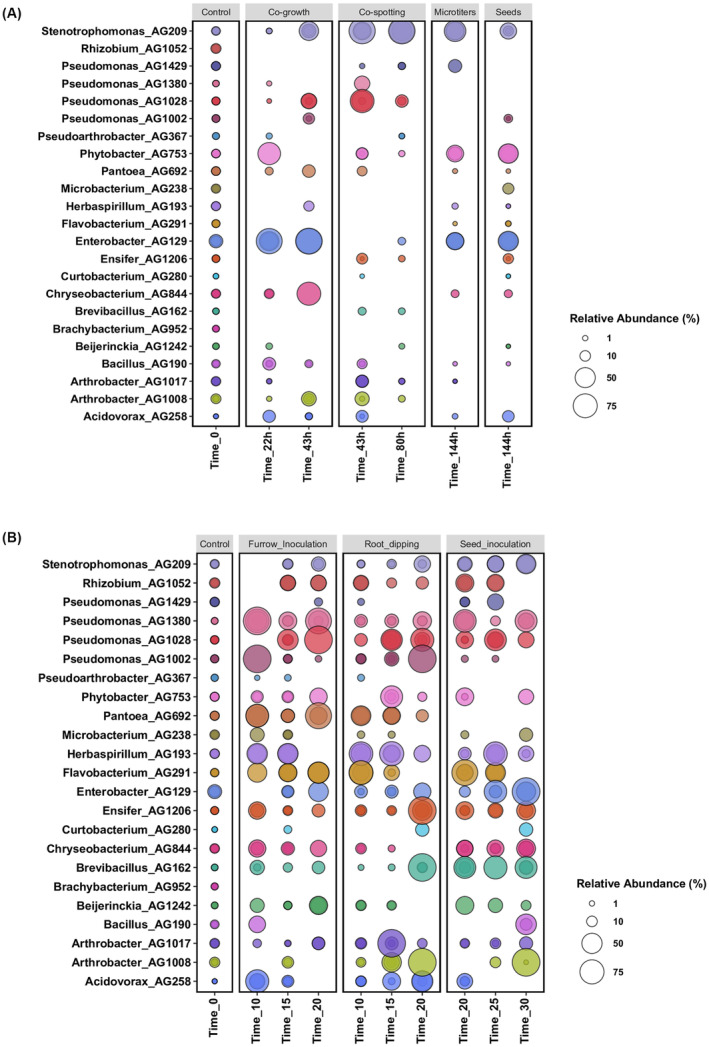
FIGURE 3.

(A) Bubble plot showing the relative abundance of the 23 bacterial endophyte strains (y‐axis) used in vitro co‐growth experiments, as obtained from 16S rRNA gene sequencing analysis. The samples are arranged according to the time points (x‐axis) and subplot according to the type of compatibility growth experiments (i.e. co‐growth in liquid medium, co‐spotting in solid plates and Microtitres and Seeds biofilm growth conditions). (B) Bubble plot showing the relative abundance of each bacterial endophyte strain (y‐axis) used in planta co‐growth experiments. The samples are arranged according to the time points (x‐axis) and subplot according to the type of inoculation method used (i.e. Furrow inoculation, Root dipping and Seed inoculation). Control denotes samples collected immediately after co‐inoculum setup. The size of the bubble represents the relative abundance and the median of the percentage of at least three replicates, and colours indicate each bacterial strain used in this experiment.
