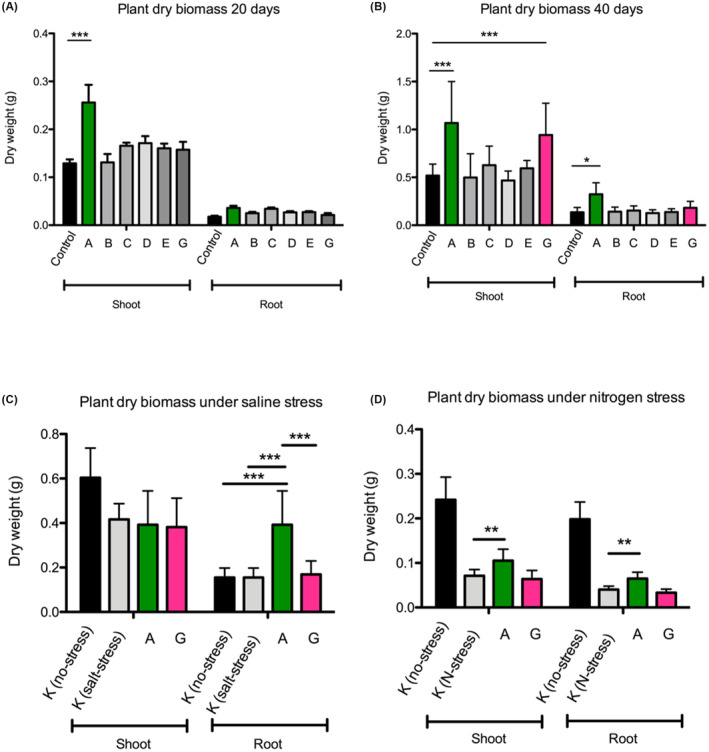
FIGURE 5.

Plant growth promotion assays performed on rice of the 5‐strain bacterial consortia under normal growth conditions (A at 20 days post inoculation and B at 40 days post inoculation) and under abiotic stress conditions (C at 20 days post inoculation under salt stress and D at 20 days post inoculation under nitrogen stress). All data are presented as means ± SEM. GraphPad Prism 8.2 (GraphPad Software, Inc.) was used to perform all statistical analyses. *p < 0.05, **p < 0.01, ***p < 0.001, as indicated. The error bars indicate SDs. See text for all details.
