
Figure 1.
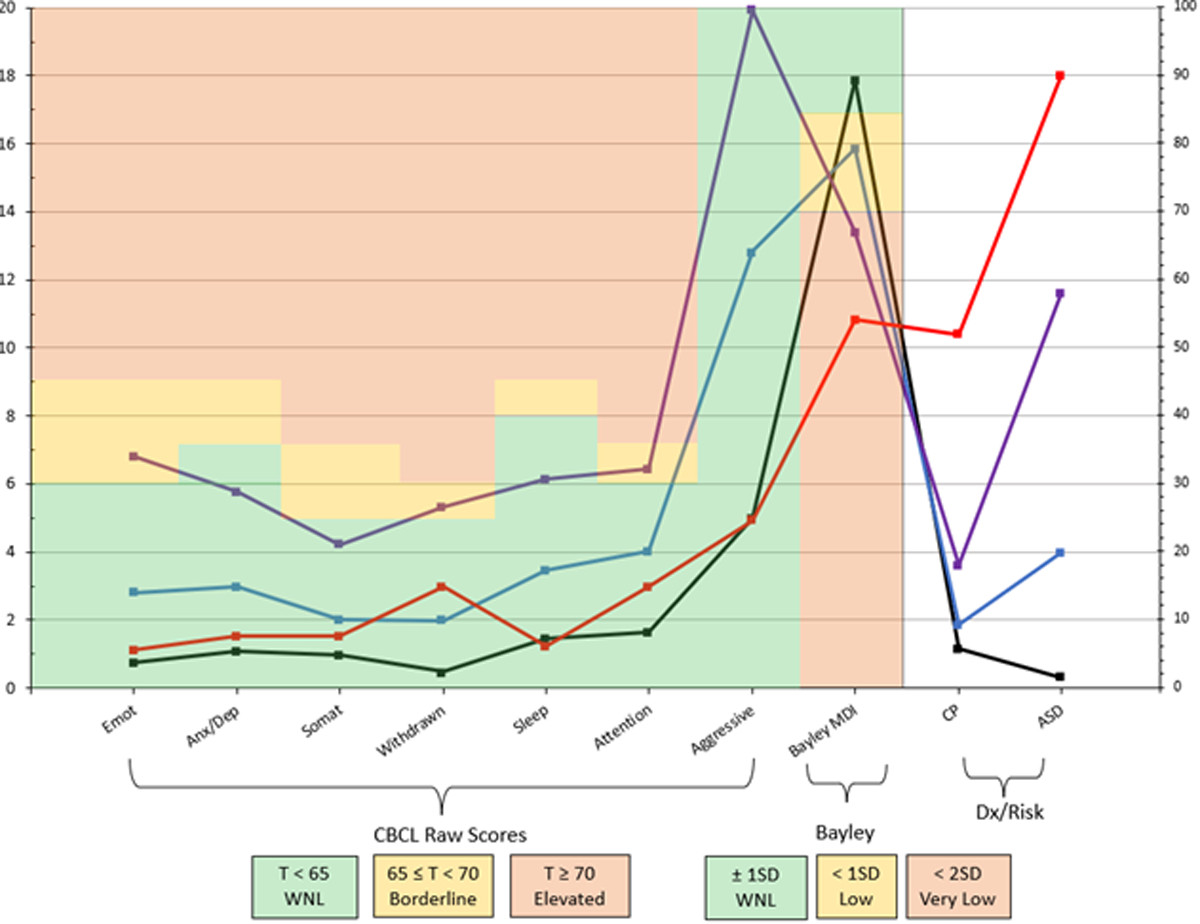
The means and percentages of outcome variables by latent profile. Profile 1 (black; 60%) had mean Bayley scores within normal limits and few behavioral problems. Profile 2 (blue; 24%) had mean Bayley scores indicative of mild impairment but few behavioral problems. Profile 3 (purple; 5%) had mean Bayley scores indicative of severe impairment and borderline elevated CBCL/1½-5 scores. Profile 4 (red; 11%) had mean Bayley scores indicative of severe impairment but few behavioral problems. CBCL/1½-5 outcomes are syndrome scale raw scores and Bayley outcome is the harmonized Mental Development Index (hMDI; normative mean=100, standard deviation=15). CP refers to a cerebral palsy diagnosis, and ASD refers to a positive screen on the M-CHAT. CBCL/1½-5 scores are plotted according to the left axis (ranging from 0–20), whereas Bayley, CP, and ASD variables are plotted according to the right axis (ranging from 0–100). Colored shading provides information about normal limits (green), borderline elevated or mild impairment (yellow), and elevated or severe impairment (red). For CBCL/1½-5, raw scores were used for model estimation, but colored shading is based on corresponding T-scores. Aggressive, aggressive problems; Anx/Dep, anxious/depressed; ASD, autism spectrum disorder; Attention, attention problems; CP, cerebral palsy; Emot, emotionally reactive; Sleep, sleep problems; Somat, somatic complaints; WNL, within normal limits.