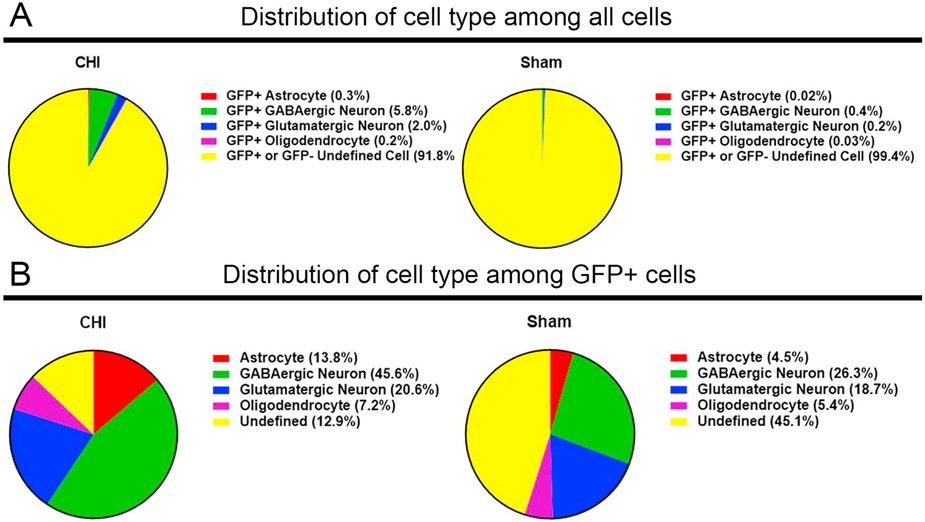
Fig. 10. Distribution of the GFP+ cell population in CHI and sham brains.
Pie charts (A) show distribution of various sham and injury-induced GFP+ neural cell populations out of all cells in CHI and sham transgenic mouse brains at 14 DPI. There is an increase of GFP+ cell types after CHI compared to sham animals. Pie charts (B) show distribution of various sham and injury-induced GFP+ neural cell populations out of all GFP+ cells in CHI and sham transgenic mouse brains at 14 DPI. In injured brain regions, there was an increased proportion of GFP+ astrocytes, GABAergic neurons, and glutamatergic neurons after CHI compared to sham animals.

