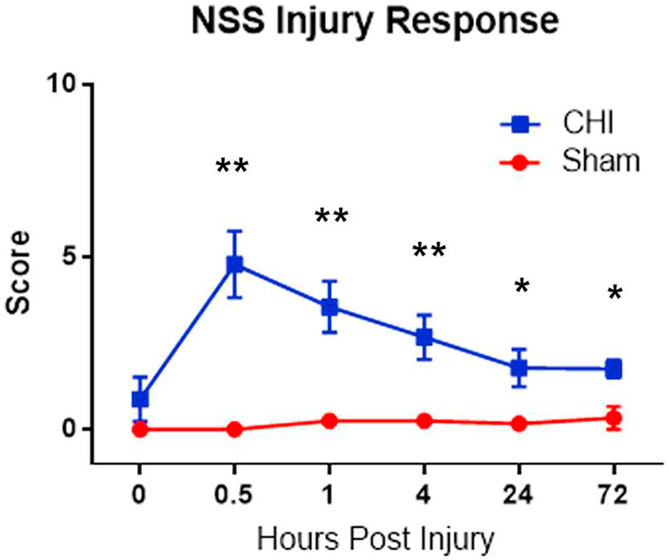
Fig. 11. Overall scores of injury response using NSS tests.
The NSS score consists of 10 individual clinical parameters, including tasks on motor function, alertness and physiological behavior. Values are expressed as means ± SD. Statistical analysis was carried out using Student-t-test for each timepoint (n = 6). Asterisk (*) indicates statistically significant differences (** P < .01 and * P < .05) in neurological deficit caused by CHI.

