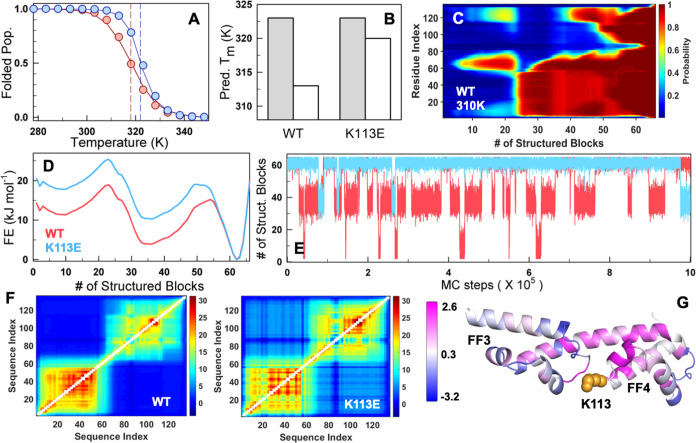
Figure 5.
Statistical mechanical modeling and coupling free energy differences. (A) The experiment-calibrated model captures trends in stability and cooperativity of both the WT (red) and K113E mutant (blue). The circles represent the folded population obtained from the far-UV CD experiment thermal melt fit. The solid lines represent the WSME model-predicted trends in the folded population. The dashed vertical lines represent the predicted Tm. (B) The predicted Tm from the mean residue folding probability of helix residues in FF3 (1–62 residues, gray) and FF4 (63–136 residues, white) highlights that it is FF4 that is primarily stabilized on the K113E mutation in agreement with experiments. (C, D) The residue folding probability projected on the reaction coordinate (C) and the predicted 1D free energy profiles (FEPs; D) at 310 K indicates a three-state-like folding mechanism. At the RC value of 35, where panel (D) predicts an intermediate and panel (C) indicates that it is primarily FF3 that is folded (residues 1–70). (E) Monte Carlo simulations on the 1D FEP show frequent transitions of the WT to an intermediate population due to a lower thermodynamic barrier. (F) The thermodynamic coupling free energy matrices of the WT (left) display very little coupling between subdomains and weak coupling within FF4 in the WT, which improves upon K113E mutation (right). (G) The difference in coupling free energies (ΔGc,K113E – ΔGc,WT) mapped onto the structure. The regions in magenta and blue indicate increased and decreased coupling with the rest of the structure upon the K113E mutation, respectively. The mutated residue is shown as orange spheres.

