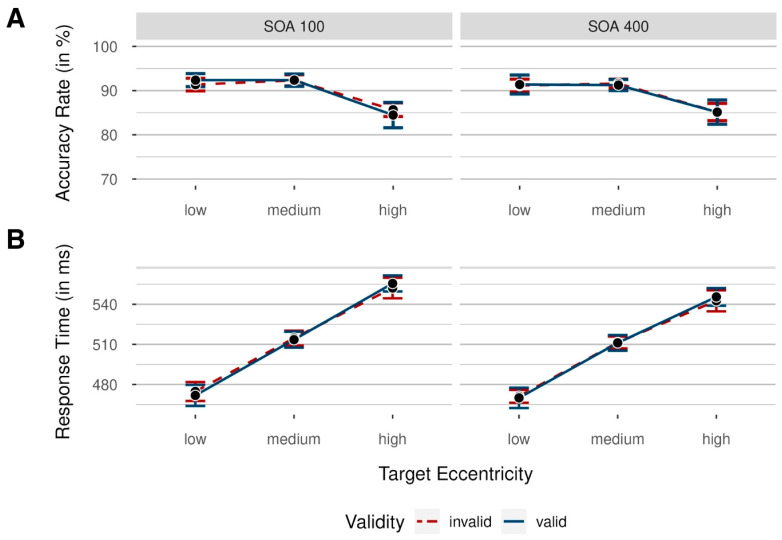
Figure 2.
Means of participants’ accuracy rates (A) and response times (B) in Experiment 1 as a function of target eccentricity (low = nearest to screen center/medium/high = farthest from screen center), colored by validity (invalid = cue shown at a different position than the target: red dashed line/valid = cue and target shown at the same position: blue solid line), for short (100 ms) and long (400 ms) stimulus–onset asynchronies (SOAs) between target and cue. Data were collapsed across both sides of the target display. Error bars indicate 95% CI based on mean values per participant and condition, correcting for within-subject designs.

