Figure 5.
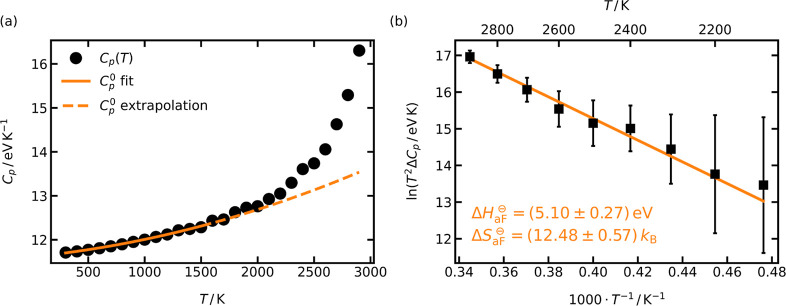
(a) Heat capacity at constant pressure, Cp, obtained from differentiating a cubic spline fit of the temperature-dependent cell energies, Cp = dUtot/dT. The solid line represents a second-order polynomial fit up to 1500 K, the temperature range with negligible amounts of anti-Frenkel defects. The dashed line is an extrapolation of the polynomial fit to 2900 K. (b) Excess heat capacity, ΔCp, calculated as the difference between the defect-free system [extrapolated values, dashed line in (a)] and the observed system (black circles). The values for ΔH⊖aF and ΔS⊖aF were obtained by fitting eq 16 with a weighted linear regression to the data. Error bars are based on the uncertainties of the second-order polynomial fit [solid line in (a)].

