
Figure 7.
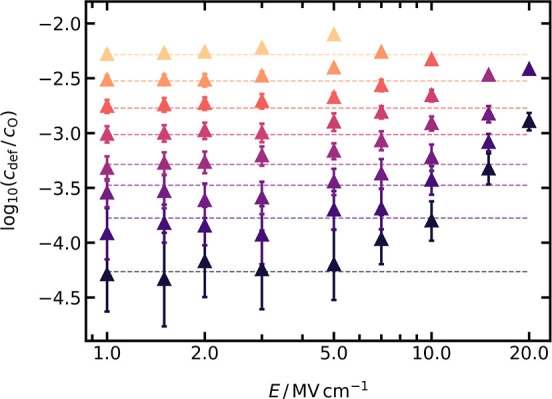
Field-dependent relative defect concentration, cdef/cO, determined with the WS analysis in the range of 2000 ≤ T/K ≤ 2875 (with 125 K steps). Every data point is the average of two independent runs, with their standard deviation included as error bars. Dashed lines are the field-independent cdef/cO values determined for LZO from Figure 4.