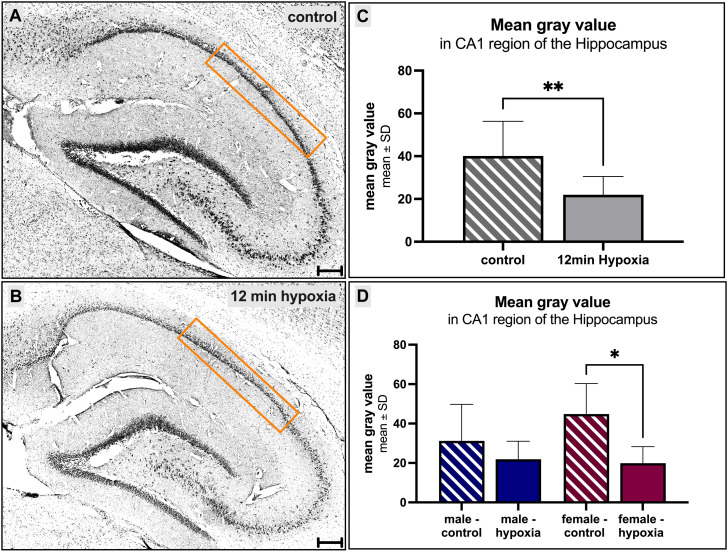
FIGURE 3.
Morphological alterations in the hippocampus after cerebral hypoxia. (A, B) showing cresyl violet-stainings, converted to grayscale. A prominent decrease of the number of cells within the CA1 region of the hippocampus under normal [(A, C, D) striped] and hypoxic [(B–D) filled] conditions is observed. Differences between the sexes were not seen (D). Scale bar in (A, B) 200 µm.

