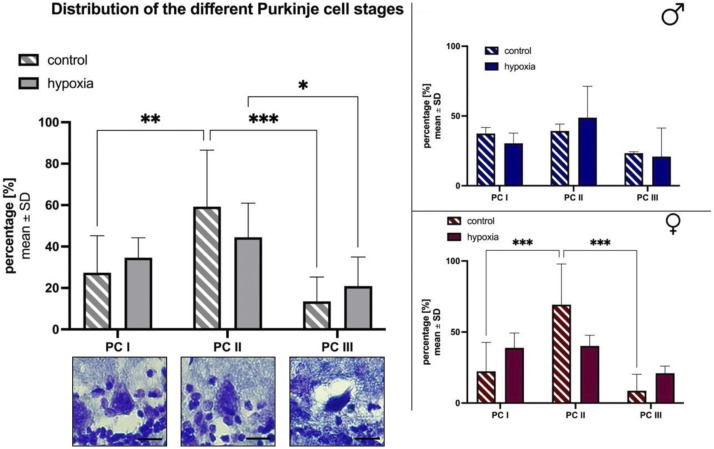
FIGURE 5.
Morphological alterations in Purkinje cells after cerebral hypoxia. The percentual total cell distribution. The photographs depict the three distinct states of cell degeneration in hypoxic rats. The scale bar has been standardized to 20 µm for reference (A). Also a subdivision between male (B) and female (C) are shown. All values are presented as mean ± standard deviation. Significances were calculated using two-way ANOVA with Sidak’s multiple comparison test. A p-value <0.05 was considered significant (*; p < 0.001 **). PC = Purkinje cell bodies.

