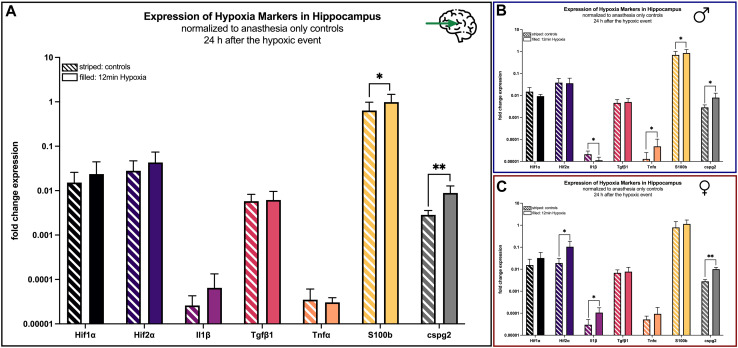
FIGURE 7.
mRNA expression of hypoxia markers in the hippocampus 24 h after hypoxemia (filled) and in animals with anesthesia only (striped). (A) all animals; (B) males only; (C) females only. Differences were calculated using the unpaired t-test. All values are presented as mean ± standard deviation (log scale). A p-value <0.05 was considered significant (*; p < 0.001 **).

