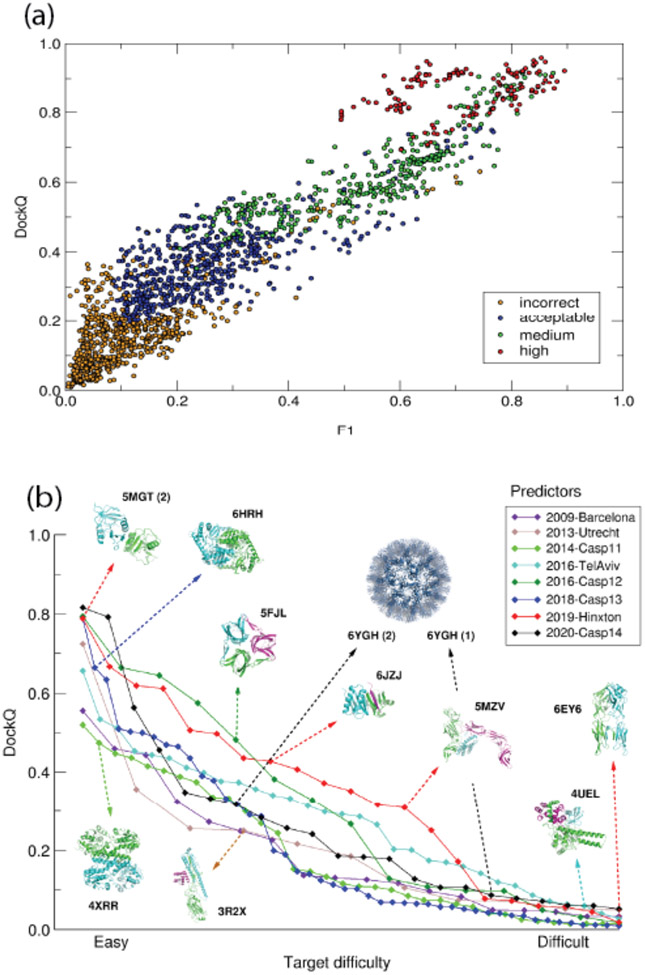
Figure 2: Accuracy levels of the best models of protein complexes in CAPRI and CASP-CAPRI prediction rounds, and the relation of the DockQ score to the CAPRI model quality categories.
(a) Scatter plots of DockQ values for models submitted by predictors for individual targets evaluated in ref (78) (vertical axis) as a function of f1 (f1= 2fnat (1-fnon_nat)/ (fnat + (1-fnon_nat)), where fnat is the fraction of native contacts recalled in the model, and (1-fnon_nat) is the fraction of predicted contacts that are native (79). Individual points are color-coded according to the CAPRI model quality category: incorrect (yellow), acceptable (blue), medium (green), high(red).
(b) DockQ values for the best models as a function of target difficulty. Individual colour coded plots refer to best models evaluated in individual CAPRI assessment periods and CASP-CAPRI prediction rounds between 2009-2020, as indicated in the legend. Examples of targets of different difficulty levels are shown together with their PDB-RCSB codes. Arrows indicate the rounds in which they were offered; numbers shown in parentheses following the PDB codes refer to the models of individual interfaces of the targets in question. Target difficulty is based on sequence and structure similarity to other proteins with known experimental structures.

