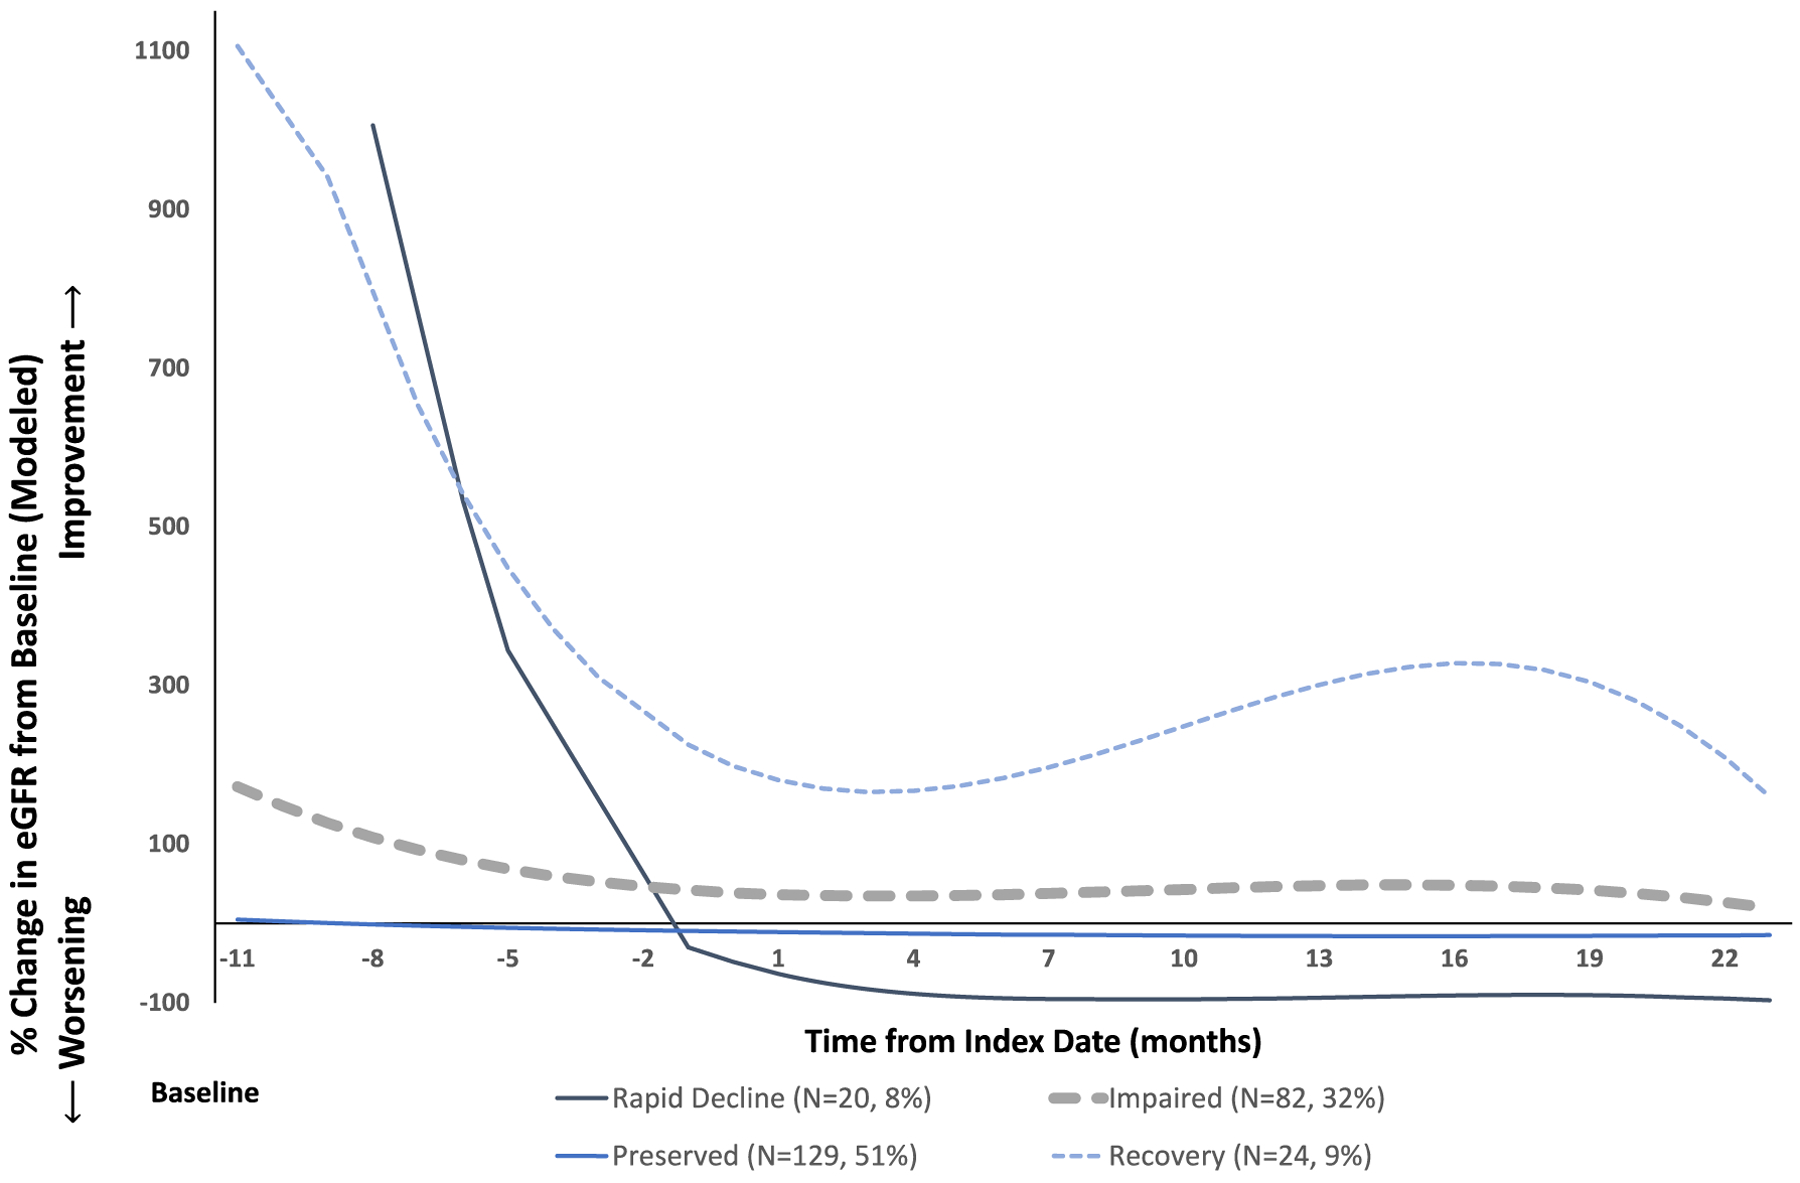
Figure 1.

Renal function trajectories in 4 groups identified by group-based trajectory modeling. This chart displays the model estimated renal function measurement at each monthly timepoint within a given trajectory group. eGFR = estimated glomerular filtration rate.
