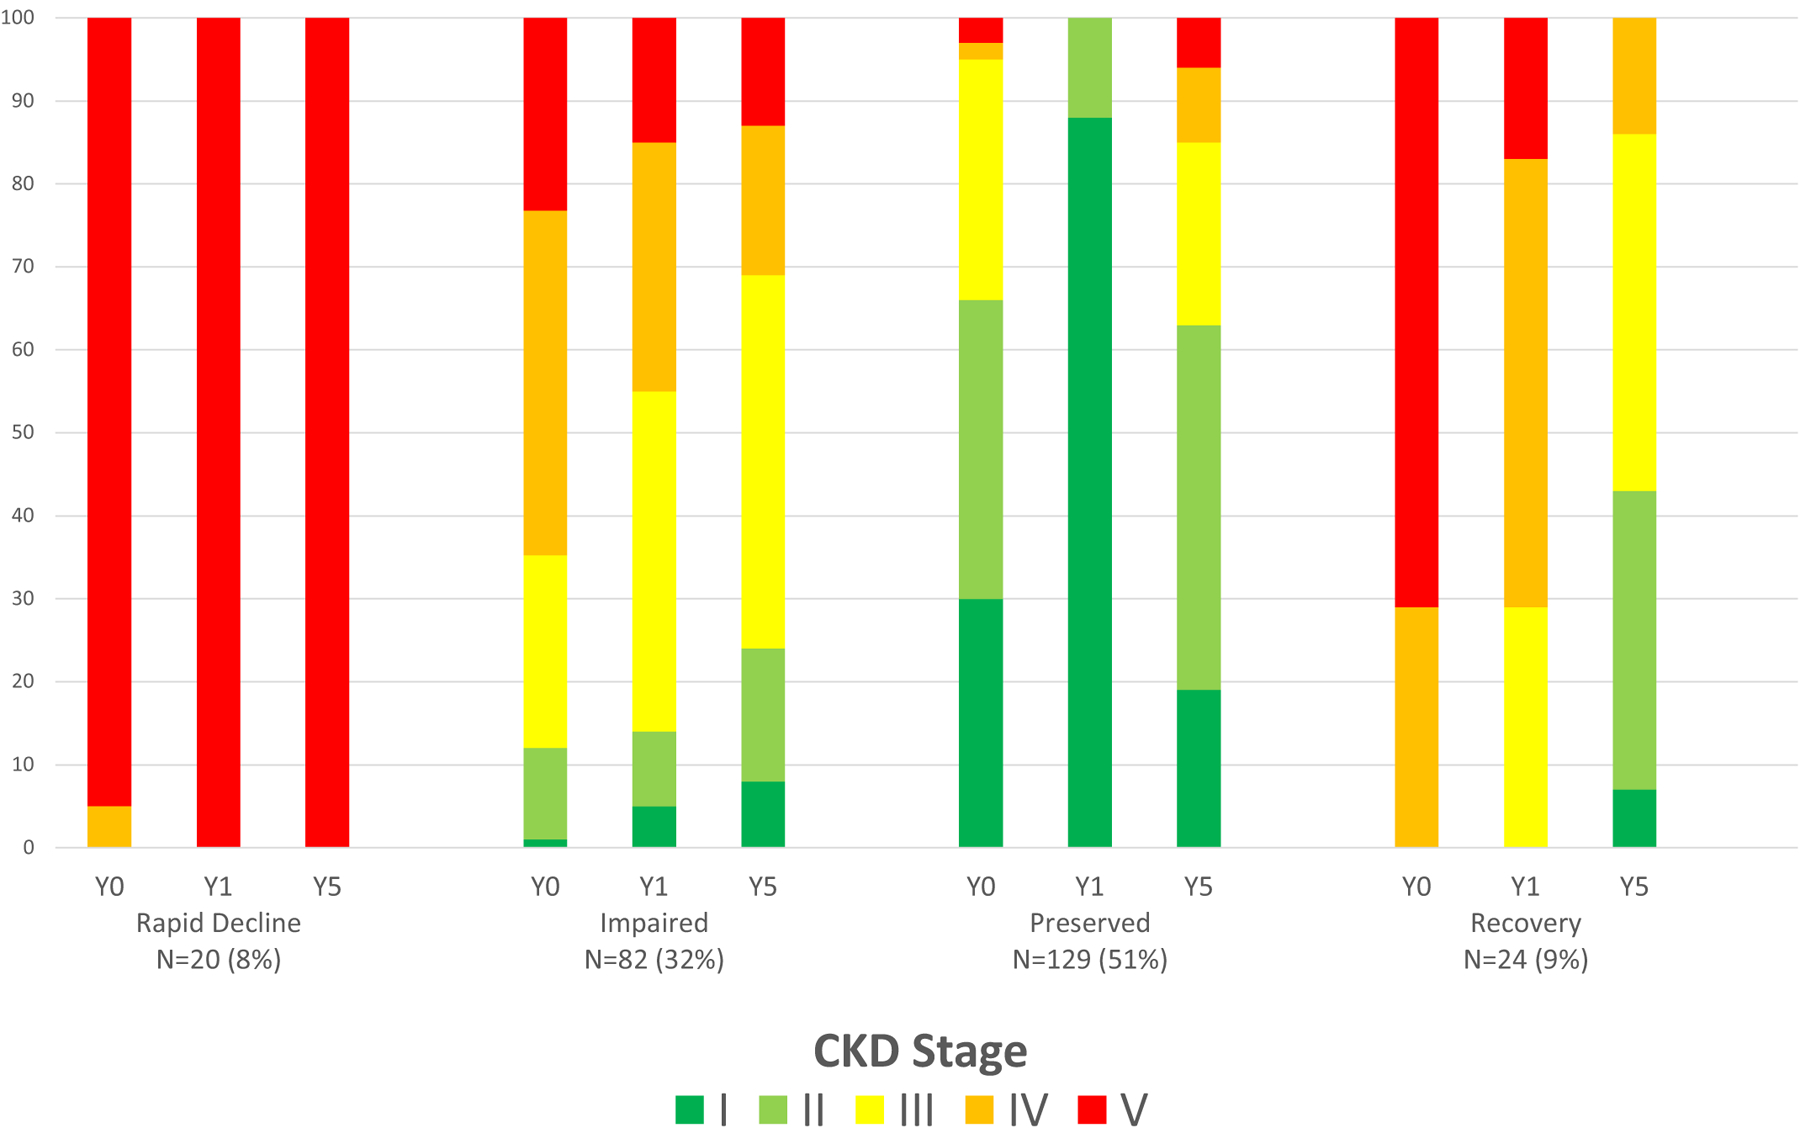
Figure 2.

Progression of renal disease as represented by chronic kidney disease (CKD) stage over time among trajectory groups. The horizontal axis depicts the year of assessment of renal function on the top line and the trajectory group on the second line. The CKD stage is depicted in colors ranging from stage 1 (green, estimated glomerular filtration rate [eGFR] >90) to stage 5 (red, eGFR <15). Data in this figure are not from the United States Renal Data System. Y0 = baseline renal function within 30 days of initiation of therapy; Y1 = CKD stage at 1 year of follow-up, averaged over 1 year; Y5 = CKD stage at 5 years of follow-up, averaged over 1 year.
