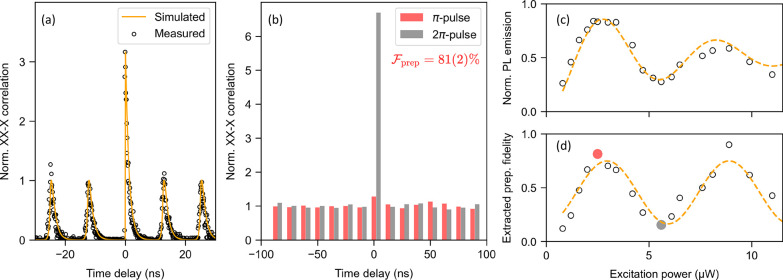
Figure 3.
Analysis of the preparation
fidelity via XX-X photon cross-correlation
experiments: (a) Measured cross-correlation histogram after polarization
and blinking correction (grey bars), matching the Monte Carlo simulation
(orange line) of expected polarization-filtered XX-X correlation for
a QD with a DOP of 33% and a preparation fidelity of 81%. (b) Comparison
of polarization-corrected and integrated coincidences at π-power
(red) and at 2π-power (gray, shifted for clarity) shows difference
in preparation fidelity. (c) Summed XX and X emission intensity oscillation
as a function of excitation power with Rabi fit from Figure 2a (orange line) for comparison.
(d) Preparation fidelity  extracted from cross-correlation histograms
as a function of excitation power. Red and gray circles indicate the
data sets shown in panel (b) (orange line is a guide to the eye).

