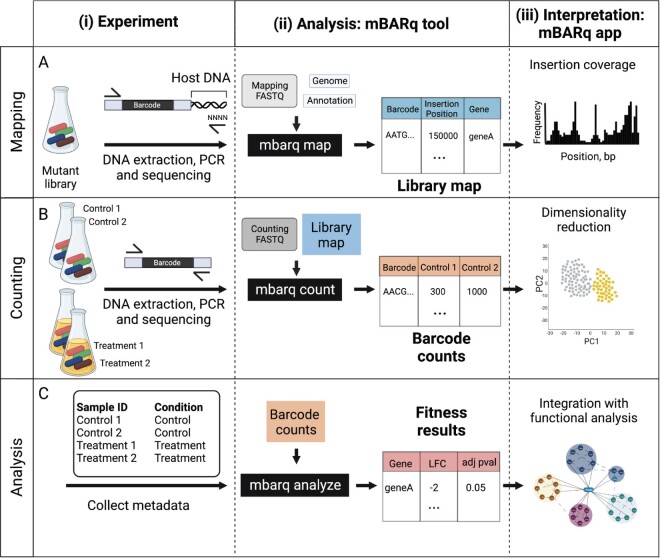
Figure 1.
A universal and versatile framework for the analysis of barcoded transposon mutagenesis screens. (A) Mapping. The mapping step determines the genomic location of each of the barcoded insertions in the mutant library. On the experimental side, this involves (i) extracting DNA from the mutant library, amplifying, and sequencing the barcode, as well as a stretch of the host chromosome. The amplification in this step is accomplished using a PCR reaction with a construct-specific primer, and a random primer to allow host amplification. (ii) Using the sequencing data generated in (i), the mBARq tool generates a library map, which specifies the genomic position for each barcoded insertion, as well as genomic features associated with it. (iii) Users can upload the library map generated in (ii) to the mBARq web app to visualize insertion coverage across the genome, and generate library statistics (i.e. number of unique insertions, number of genes with an insertion, etc.). (B) Counting. The experimental setup for the transposon mutagenesis screen involves (i) subjecting mutant libraries to a specific challenge (i.e. drug treatment, specific culture conditions). This challenge is followed by DNA extraction, barcode amplification, and sequencing steps for each of the samples. The amplification in this case is accomplished using two construct-specific primers. (ii) Using the sequencing data from this step and the library map created in A, the mBARq tool quantifies the abundance of each of the barcodes across samples and generates a barcode count table. (iii) Users can upload the barcode count table generated in (ii) to the mBARq web app for interactive exploratory data analysis. (C) Statistical analysis. (i) mBARq allows the user to identify which mutants were sensitive to the challenge administered in (B). This is accomplished by quantifying the differences in abundances of barcodes associated with each gene before and after the challenge. Using the metadata about the experiment (i) and barcode counts generated in (B), the mBARq tool can perform statistical analysis of the barcode abundances to provide a fitness results table, listing log2 fold changes (LFC) and statistics for each gene that was disrupted in the library (ii). (iii) Users can upload the fitness results table generated in (ii) to the mBARq web app for functional analysis with STRING and KEGG databases. Figure created with BioRender.com.

