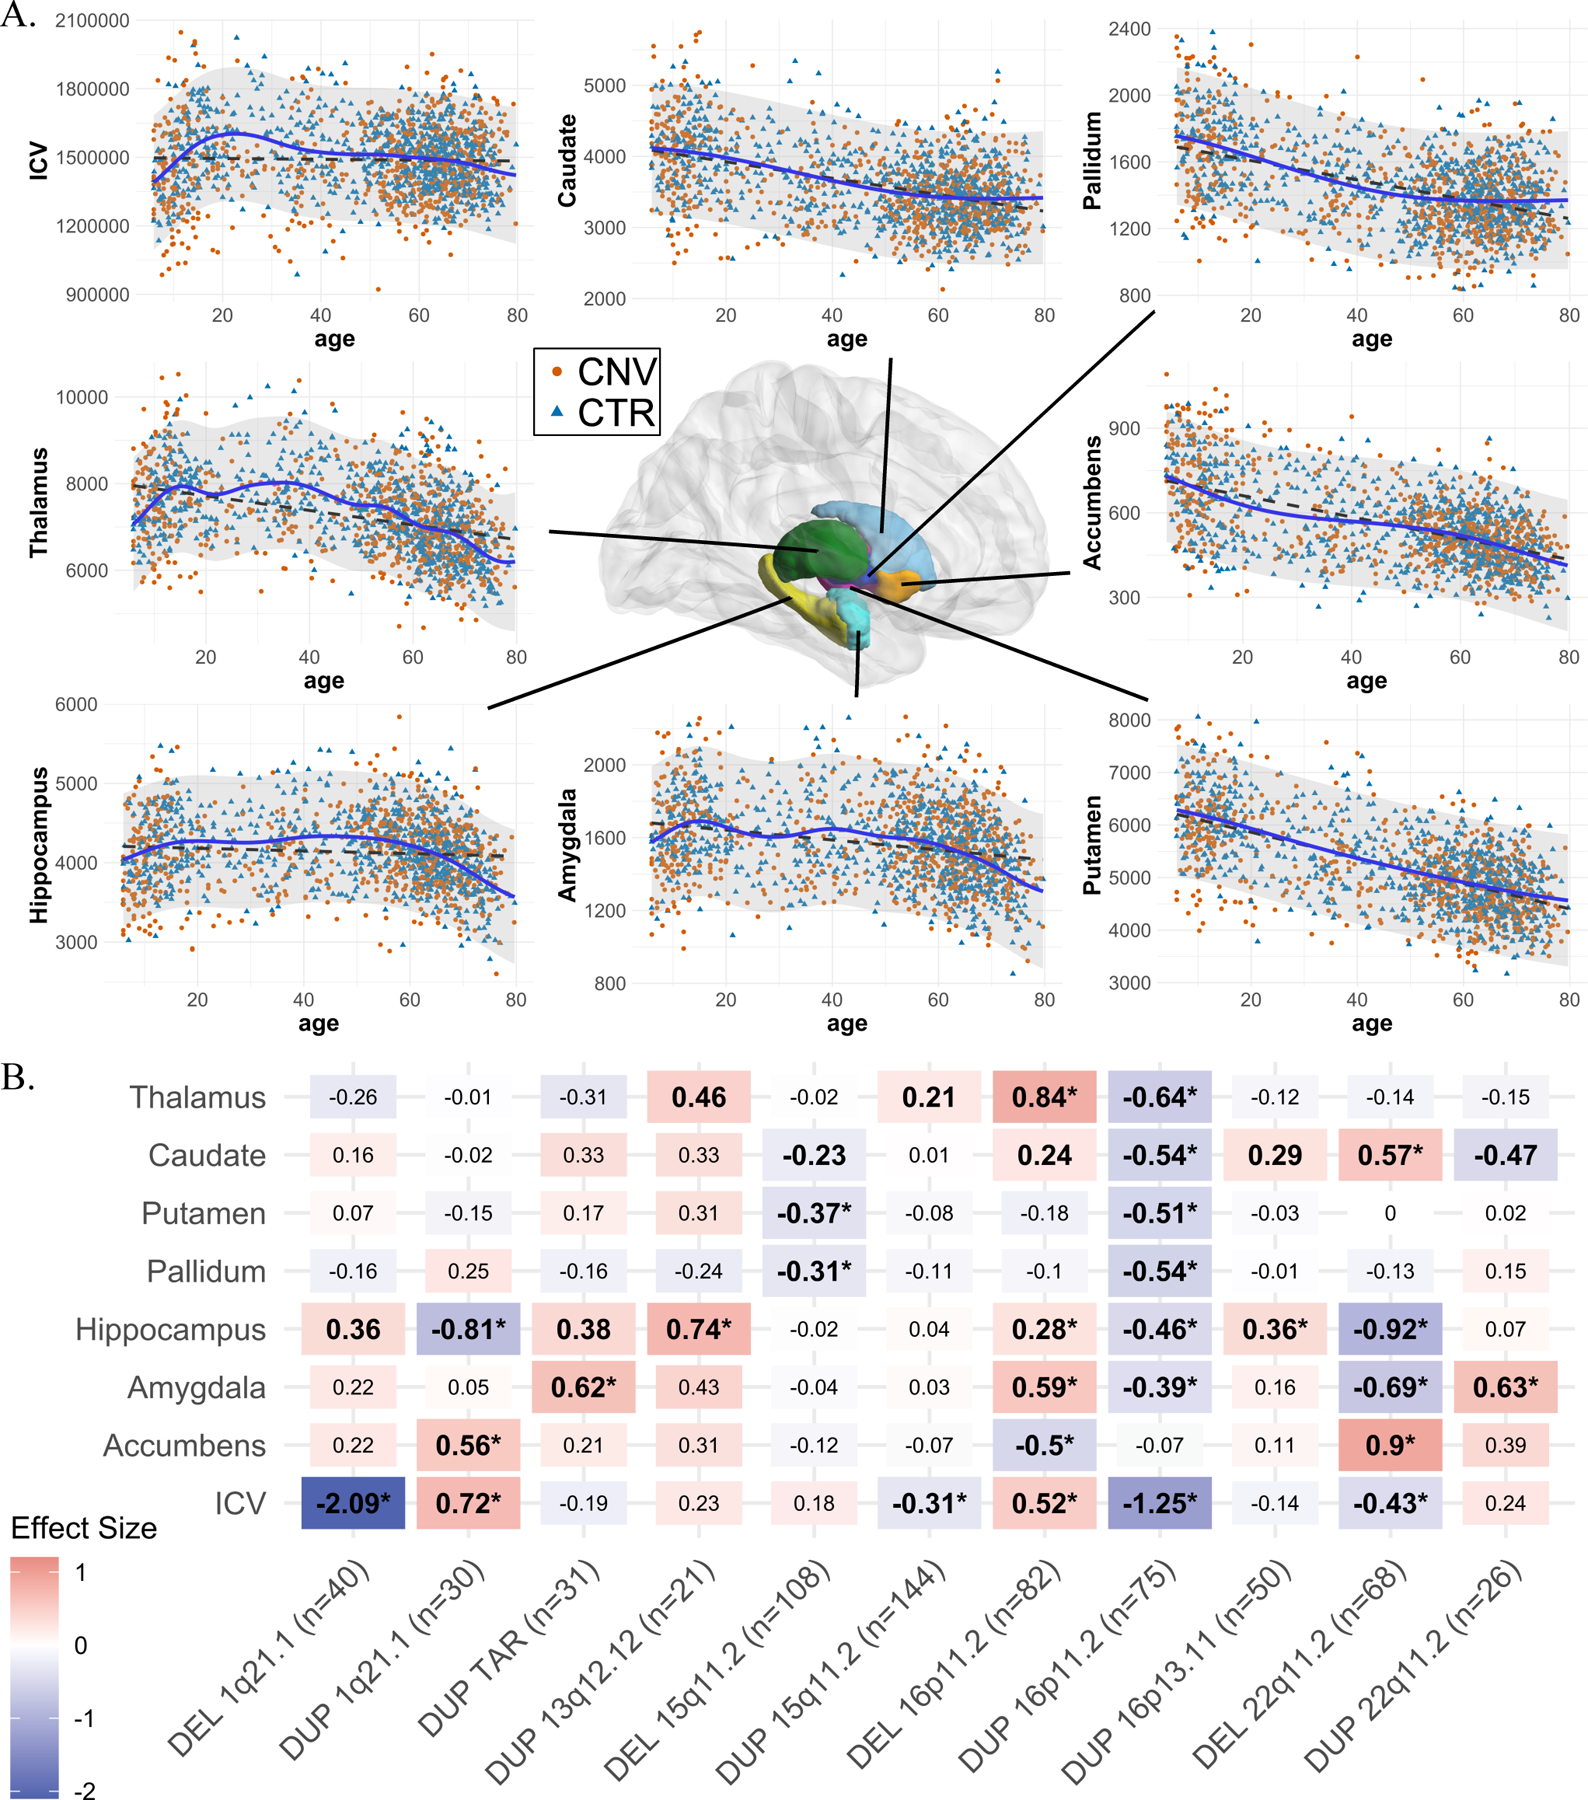
Figure 1: Normative age modeling and subcortical volume effect sizes.

A) Scatterplots showing the distribution of ICV and subcortical volumes with age, along with Gaussian processes modeling (solid line) and a linear model (dotted line). All CNV carriers (CNV) and controls (CTR; which are used for Gaussian processes modeling) are shown as points. B) Cohen’s d values for subcortical structures and ICV for 11 CNVs. Case-control differences were calculated (lm function in R) using W-scores (derived from Gaussian processes modeling). W-score already includes adjustments for age, sex, site, and ICV. Significant effect sizes with nominal p-value <0.05 are in bold, and FDR p-value <0.05 are shown with an asterisk (*); FDR correction was applied across all CNVs and structures. Darker red or blue represent higher positive or negative effect sizes. Sample sizes for each analysis (for ICV) are reported in parentheses along with x-axis labels. DEL: deletions; DUP: duplications; ICV: Intracranial volume. Detailed effect sizes, standard error (SE), and p-values are reported in Figure SF2.
