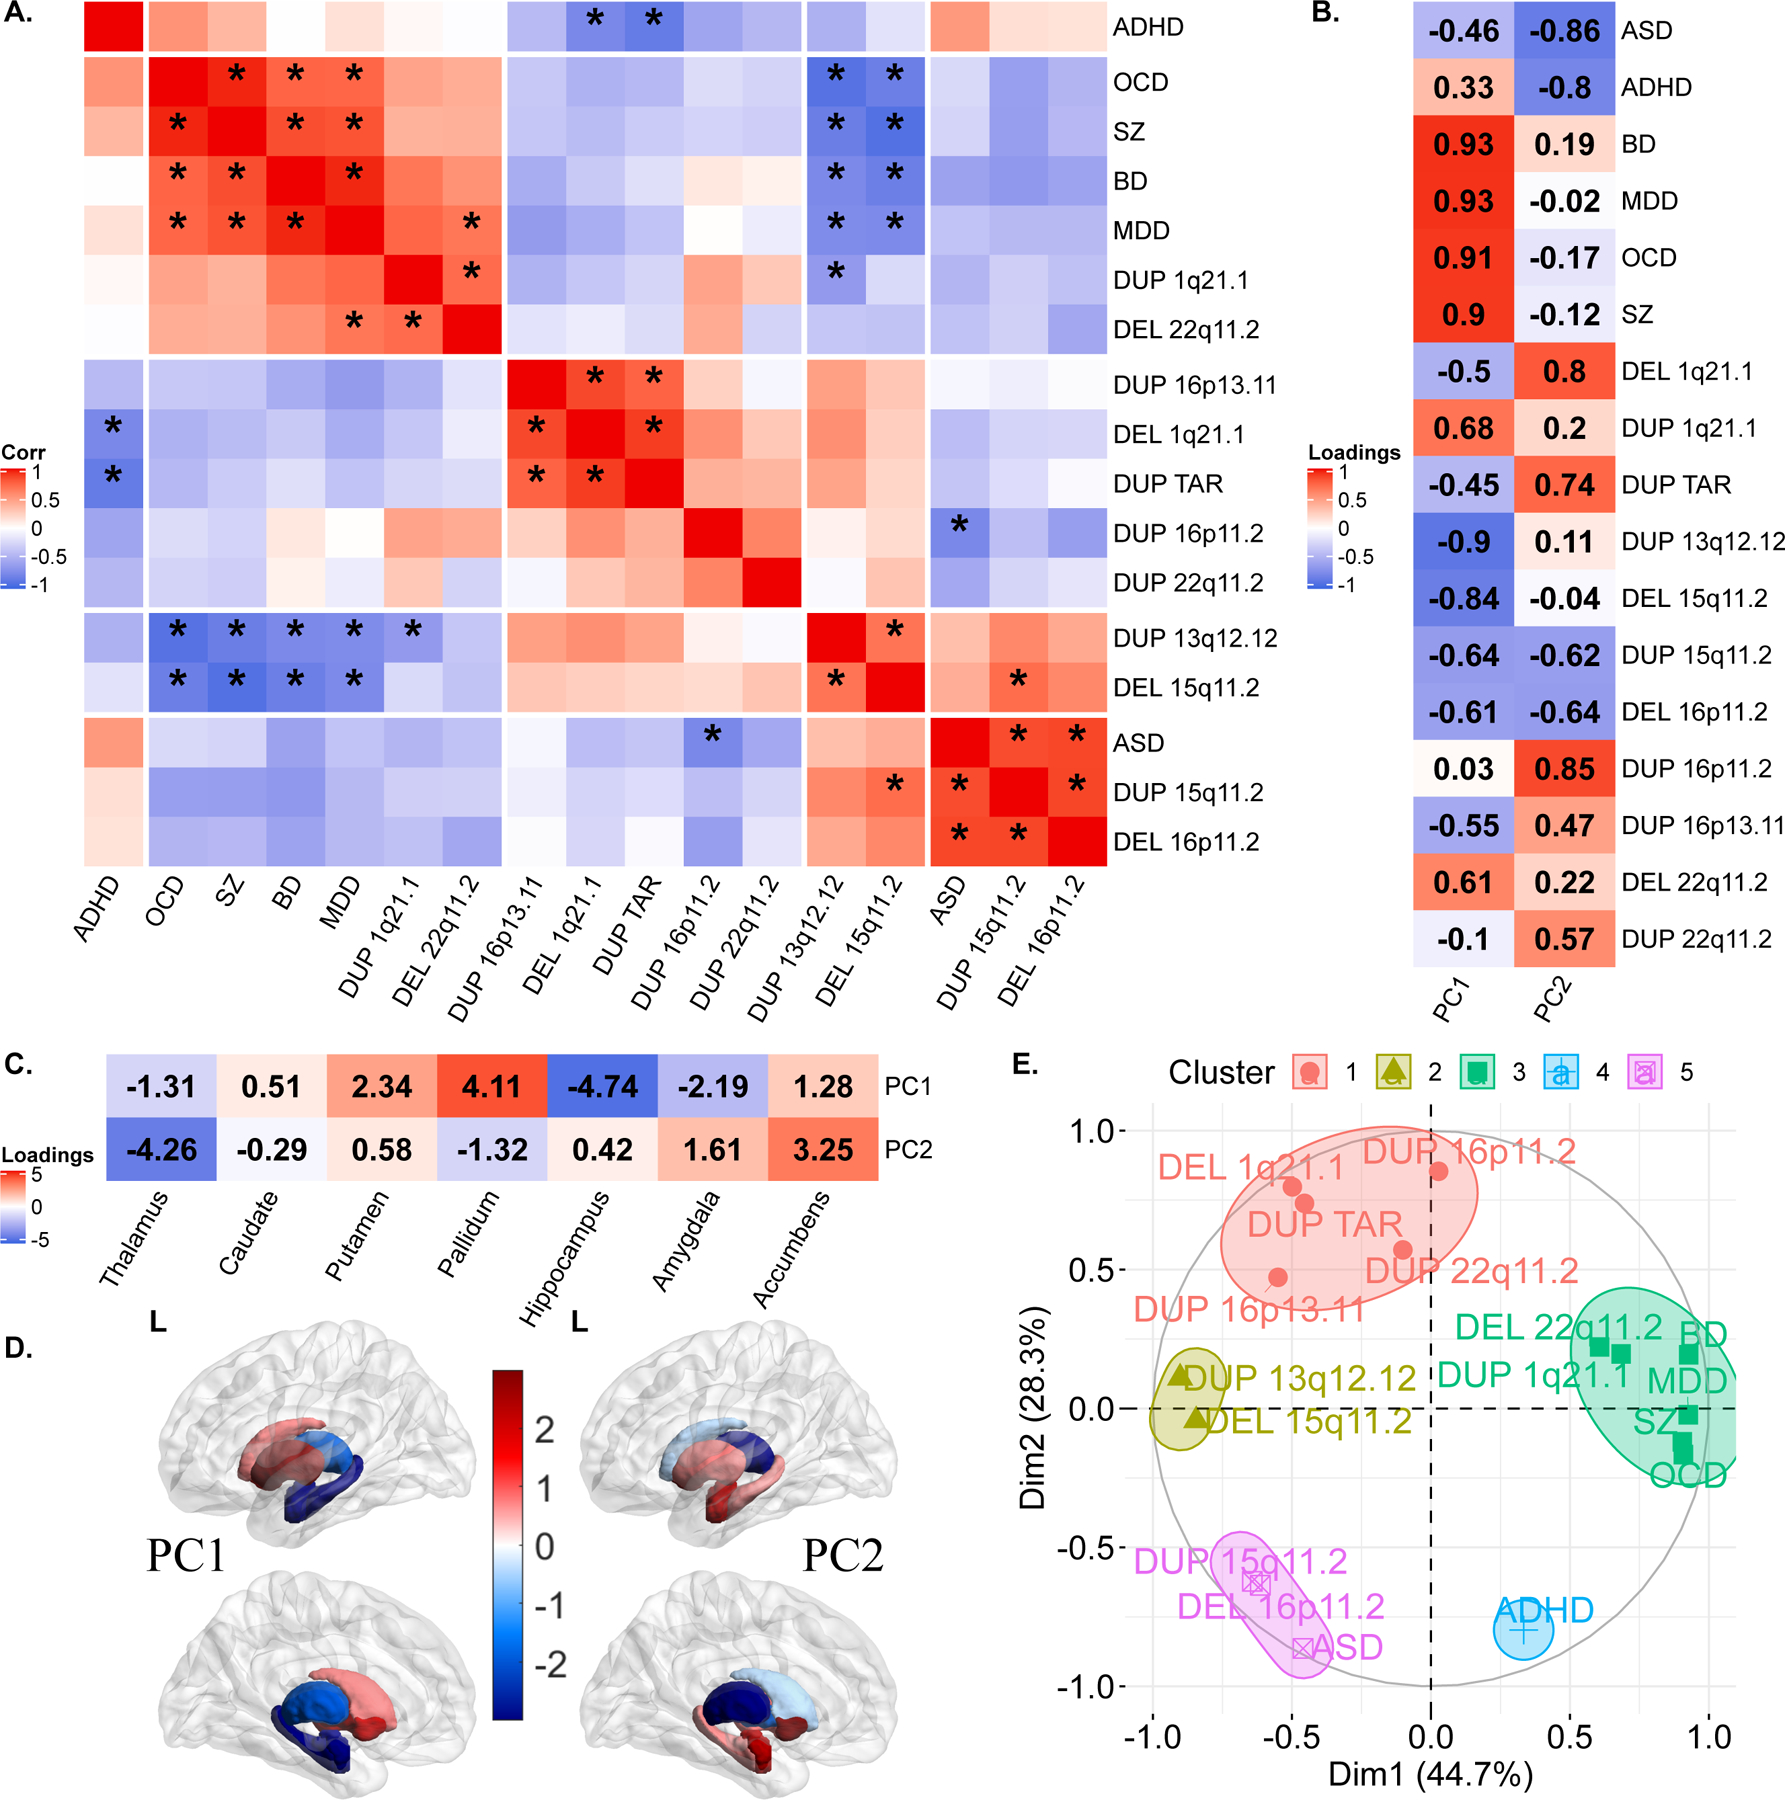
Figure 3: Correlations and principal components analysis across CNVs and NPDs.

A) Correlations between Cohen’s d profiles of CNVs and NPDs. * represent p-value <0.05 (BrainSMASH). Hierarchical (Ward distance) clustering based 5 clusters are separated using white spaces.
B-E) Principal components analysis across subcortical volumes of 11 CNVs and 6 NPDs. B) Variable loadings on PC1 and PC2; C) Subcortical structures’ loadings; D) PC1 and PC2 loadings mapped on subcortical structures. (E) Correlation circle showing CNVs and NPDs in PC1 and PC2 space. CNV-NPD groupings obtained using K-means clustering (k=5 clusters) in the PC space (Euclidean distance).
Abbreviations, CNV: copy number variants; DEL: deletion; DUP: duplication; NPD: neurodevelopmental and psychiatric disorders; Corr: Pearson correlation; ASD: autism spectrum disorder; ADHD: attention deficit hyperactivity disorder; BD: bipolar disorder; MDD: major depressive disorder; OCD: obsessive-compulsive disorder; SZ: schizophrenia; PC: principal component; L: left hemisphere; Dim: dimension.
