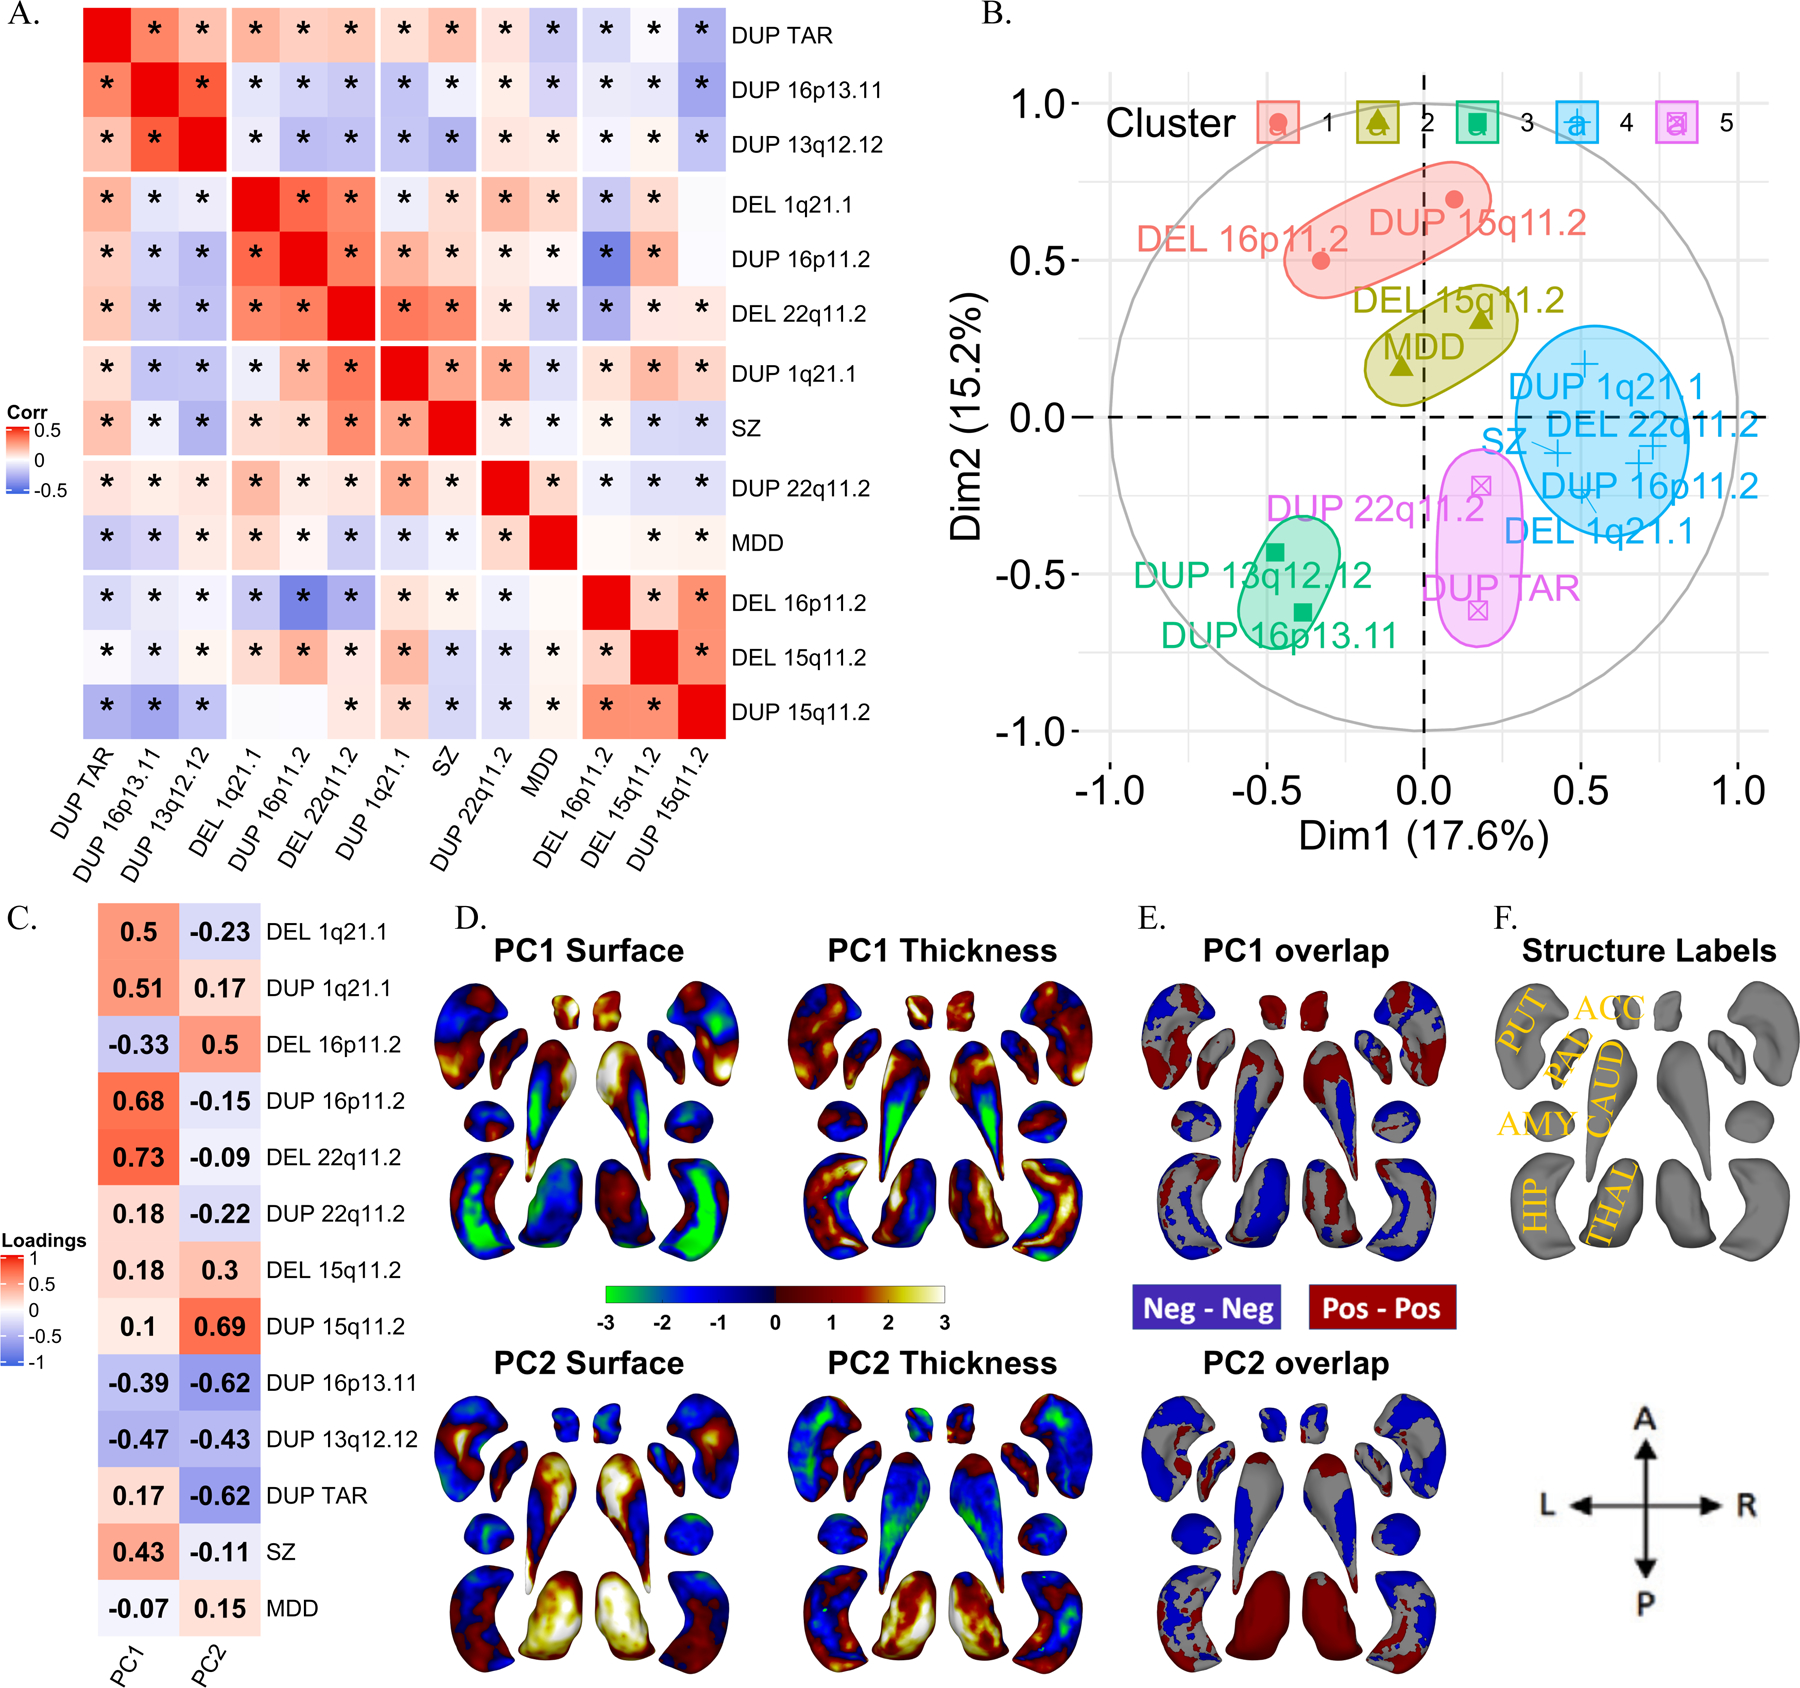
Figure 4: Correlations and principal components analysis across vertex-wise Cohen’s d maps of CNVs and NPDs.

A) Correlations between vertex-wise Cohen’s d profiles of CNVs and NPDs. * represent p-value <0.01 (parametric test). Hierarchical (Ward distance) clustering based 5 clusters are separated using white spaces. B) Correlation circles with CNV and NPD clusters in PC1-PC2 space; C) CNV and NPD loadings of principal components 1 and 2.; D) PC1 and PC2 brain maps (dorsal views); E) overlap of PCs of thickness and surface; F) structures’ labels and dorsal view directions. Thickness represents local radial distance, and surface represents local surface area dilation/contraction. Principal components analysis was run with CNVs as variables and vertices as observations (stacked across surface and thickness metric and all subcortical structures; Z-scored). For PC maps, blue/green and red/yellow colors indicate negative and positive coefficients respectively. For overlap maps, blue and red represent negative-negative / positive-positive thickness and surface PC loadings at each vertex respectively. Ventral views are shown in Figure SF12.
Abbreviations, DEL: deletion; DUP: duplication; PC: principal component; Dim: dimension; MDD: major depressive disorder; SZ: schizophrenia; ACC: accumbens; AMY: amygdala; CAUD: caudate; HIP: hippocampus; PUT: putamen; PAL: pallidum; THAL: thalamus; Directions: L-left, R-right, A-anterior, P-posterior.
