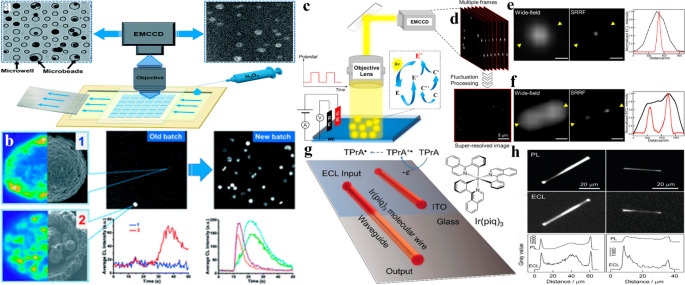
Figure 3.
(a) CL-based imaging setup designed for detecting and imaging single microbeads. (b) Representative CL kinetic curves (left panels) and averaged CL images (right panels) from the old and new batches of microbeads during reaction with H2O2, respectively. Reprinted from ref (26) with permission from the Royal Society of Chemistry, copyright 2019. (c) Schematic showing the single particle imaging with ECL microscopy setup. E symbolizes the luminophore (Ru(bpy)32+), while C represents the coreactant (TPrA). (d) SRRF analysis (basic principle) of multiple frames (images). (e, f) Wide-field ECL images (left panels), super-resolution ECL images (middle panels), and corresponding line profiles (drawn from the areas/regions between yellow-colored arrowhead) of an individual Au nanosphere and separated Au nanospheres, respectively). Scale bar: 500 nm. Reprinted from ref (80) from American Chemical Society, copyright 2021. (g) Schematic drawing showing the ECL waveguide in an individual crystalline molecular wire of Ir(piq)3 on an electrode surface (patterned ITO). (h) Representative PL (top), ECL (middle) images, and corresponding grayscale variations of two molecular wires along the longitudinal axis. Reprinted from ref (83) with permission from Wiley-VCH, copyright 2020.

