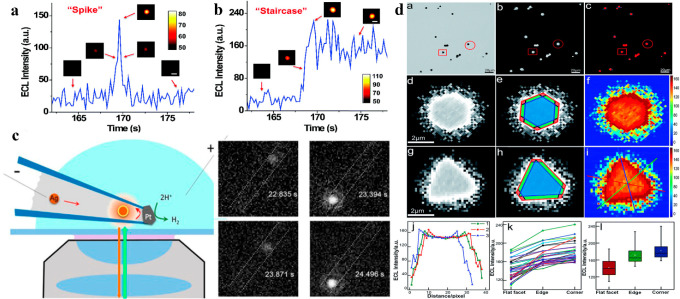
Figure 5.
Single NP collisions generated discrete ECL signals: (a) “spike” and (b) “staircase.” Inset: ECL images of a single NP during collision events. Exposure time: 0.2 s; scale bars: 2 μm; constant potential: 1.4 V. Reprinted from ref (85) with permission from the Royal Society of Chemistry, copyright 2018. (c) Schematic illustration of the experimental setup utilized for FL imaging of single Ag NP collision events inside a microfabricated nanocell (nanopipette) (left column). FL images represent the individual particle collision responses under different time periods (right column). Reprinted from ref (89) from American Chemical Society, copyright 2017. (d) A series of images showing the spatial distribution of ECL intensities on an individual Au nanoplate. Representative bright-field (a), ECL (b), and corresponding false-color overlay image (c). Enlarged version of red circled areas (d, g) of the ECL image (b). Divided regions of flat surface facet (blue), edges (green), and corners (red) in (e, h) ECL images. Matlab obtained ECL intensities with a 2D spatial distribution (f, i). ECL intensity gradients (j) for three recording lines shown in (i). Statistical and box charts illustrate site-specific ECL intensities. Reprinted from ref (46) with permission from the Royal Society of Chemistry, copyright 2019.

