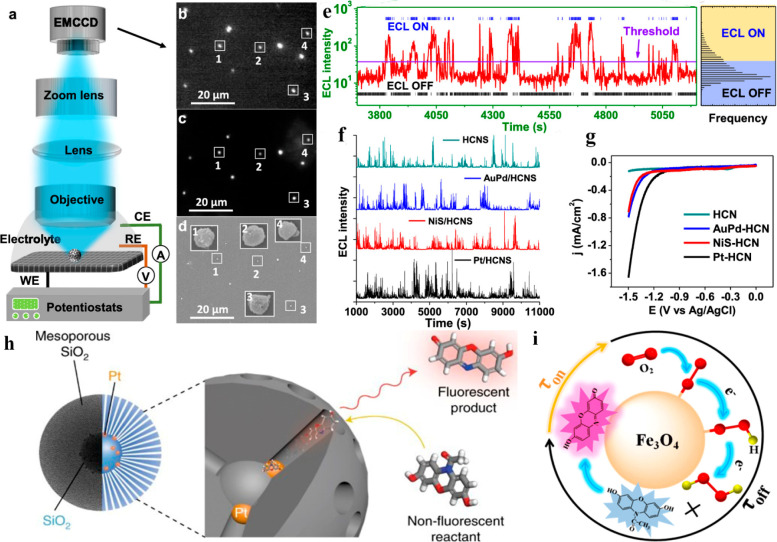
Figure 6.
(a) Schematic showing the setup of ECL microscopy applied for monitoring HER at an individual NP level. Colocalization analysis of (b) ECL, (c) FL, and (d) SEM images of the same HCNSs sets. (e) ECL trajectory of a single HCNS during a constant (−1.5 V) negative potential. ECL OFF state (black stick marking) and ECL ON state (blue stick marking) were distinguished for statistical analysis by setting the threshold. (f) ECL trajectories of Pt-HCNS, NiS-HCNS, AuPd-HCNS, and pristine HCNS, at −1.5 V. K2SO4 (100 mM) solution containing K2S2O8 (100 mM) coreactant was used as electrolyte. ECL and FL imaging exposure time was 1 s. (g) Resulting polarization curves for the HER at 5 mV/s (scan rate) in the K2SO4 (100 mM) electrolyte. Reprinted from ref (84) from American Chemical Society, copyright 2020. (h) Scheme showing a nanocatalyst image in nanoconfinement that consist of PtNPs (5 nm) sandwiched between a mesoporous SiO2 shell (120 nm) and a solid SiO2 core (100 nm). The nonfluorescent (AR) reactant molecule was oxidized (catalytically) at the PtNPs active surface sites to produce fluorescent (resorufin) product molecule. Reprinted from ref (127) with permission from Springer Nature, copyright 2018. (i) Schematic revealing the 2e ORR at a single Fe3O4 NPs level. Reprinted from ref (128) from American Chemical Society, copyright 2020.

