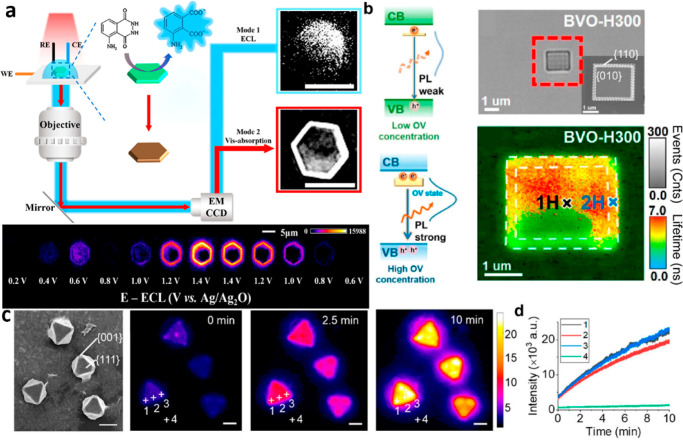
Figure 7.
(a) Schematic showing the dual-mode imaging of a single nanoplate of the Co(OH)2 OER process using Vis-Absorption and ECL. ECL imaging (bottom part) achieved under applied voltage from 0.4 to 1.5 V. Reprinted from ref (130) from American Chemical Society, copyright 2023. (b) Oxygen vacancies spatial distribution tracking across varying facets of a single BiVO4 particle in an in situ manner. Reprinted from ref (131) from American Chemical Society, copyright 2023 . (c, d) PL images of single Cu2O microcrystals over different periods of time for revealing their corresponding heterogeneous photocorrosion activity. Reprinted from ref (132) from American Chemical Society, copyright 2022, .

