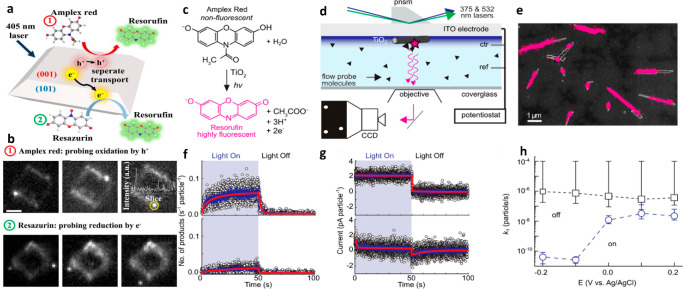
Figure 8.
(a) Schematic showing the photocatalytic oxidation and reduction reactions of AR and resazurin on an individual TiO2 particle, respectively. (b) Single-molecule FL images reveal the photocatalytic oxidation ① of AR and reduction ② of resazurin on a single TiO2 particle at various times. Inset in ①: Time trace of FL intensity recorded over the yellow-color circled area. Scale bar: 1 μm. Reprinted from ref (134) with permission from the US National Academy of Sciences, copyright 2019. (c) Scheme showing the conversion mechanism of nonfluorescent AR to FL resorufin. (d) TIRFM setup for single-molecule FLM. (e) SEM graphic presenting the TiO2 NRs onto an ITO surface. Wherein pink color spots symbolize single product molecules. (f, g) Images showing the photoelectrochemical current dynamics and surface reaction intermediates vs electrochemical applied potential. (h) Image plotting the rate constant potential dependence under light Off (black squares) and On (blue circles) intervals. Reprinted with permission from ref (92) with permission from the Electrochemical Society, copyright(2019.

