Figure 1.

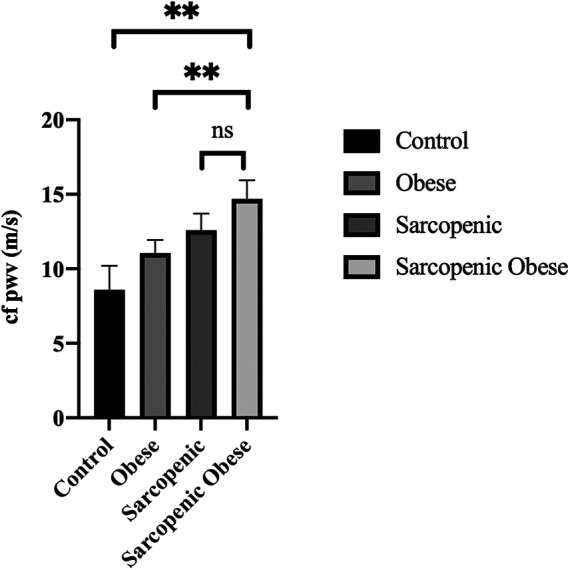
cfPWV values in different subgroups of the study population after adjustment for age, sex, MAP, and LDL cholesterol. (**p < 0.01).

cfPWV values in different subgroups of the study population after adjustment for age, sex, MAP, and LDL cholesterol. (**p < 0.01).