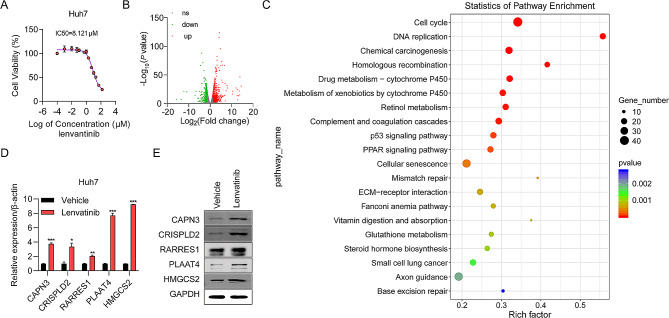
Fig. 1.
Upregulated genes in lenvatinib-treated HCC cells identified by RNA-seq analysis. (A) IC50 value of lenvatinib for HuH7 cells determined by CCK-8 assay. Each point on the dose–response curves represent three technical replicates. (B) Volcano map showing mRNAs upregulated (red) and downregulated (green) in the lenvatinib-treated group relative to the control group. (C) Top 20 enriched KEGG pathways in lenvatinib treated HCC cells. (D) Five new upregulated genes were verified by RT-qPCR analysis. (E) Five new upregulated genes were verified by western blot. *P < 0.05, **P < 0.01, ***P < 0.001

