Fig. 1.
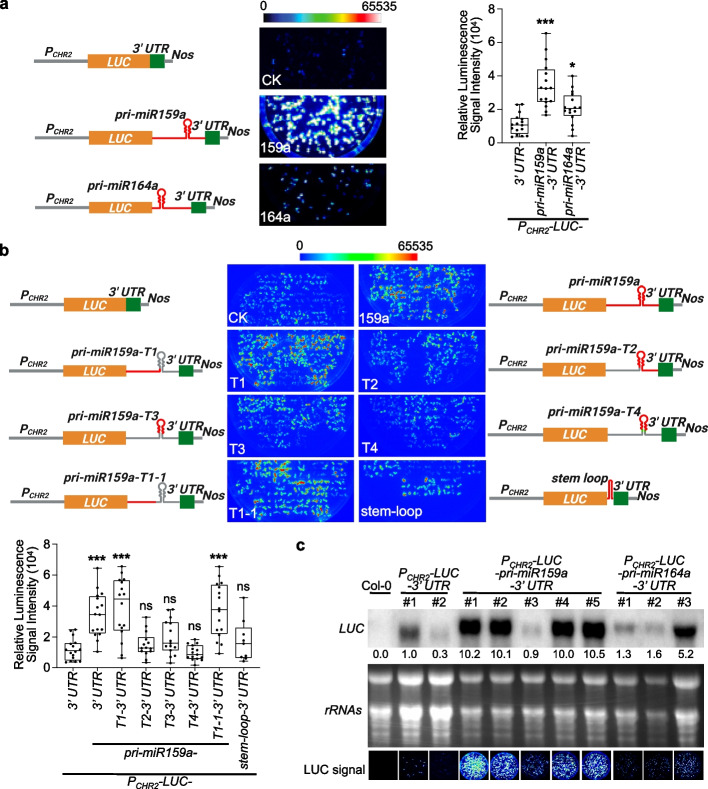
Insertion of MIR159a in 3′ UTR enhances the expression of transgene. a, b LUC signals of reporter lines expressing different constructs. (Left part) schematic constructs. PCHR2, the native promoter of CHR2 locus; Nos, nopaline synthase terminator. For different truncated segments of pri-miR159a, the red lines represented the retained regions of pri-miR159a, while the gray regions were removed in the constructs. Be noted that pri-miR159a-T4, but not pri-miR159a-T3 contained the miR159/159* duplex (labeled in green). (Middle part) Six-day-old T2 seedlings of 16 randomly selected independent lines were photographed under charge-coupled device (CCD) camera for LUC signals. Exposure time for CCD camera was 30 S. (Right part in a and lower part in b) Quantification of luminescence results from different transgene lines. Each data point represented the mean of 10–12 plants from individual lines. For most constructs, 16 individual lines were utilized except for PCHR2-LUC-stem-loop-3′ UTR where only 9 lines were available. Whiskers represent the minimum and maximum values whereas horizontal lines in the boxplots display the 75th, 50th, and 25th percentiles, respectively. Statistical test was performed between different transgenic lines and PCHR2-LUC-3′ UTR. ns, no significance; *P < 0.05; **P < 0.01; ***P < 0.001; unpaired two-tailed Student’s t test. c RNA blot analyses of randomly selected lines showed LUC transcripts significantly accumulated in PCHR2-LUC-pri-miR159a-3′ UTR, but not PCHR2-LUC-pri-miR164a-3′ UTR, compared to PCHR2-LUC-3′ UTR. Ribosomal RNAs served as control. LUC signals of the sampled materials were shown in the bottom panels (Exposure time of 30 S under CCD camera). The relative signals of LUC blot were first normalized to that of rRNAs, and then to that of #1 of PCHR2-LUC-3′ UTR sample where the ratio was arbitrarily assigned a value of 1.0. Be noted that LUC pictures in a and c were taken under a CCD camera (Olympus DP70) different from the one used in b (Schneider Kreuznach), with each experiment having its own CK (PCHR2-LUC-3′ UTR) lines

