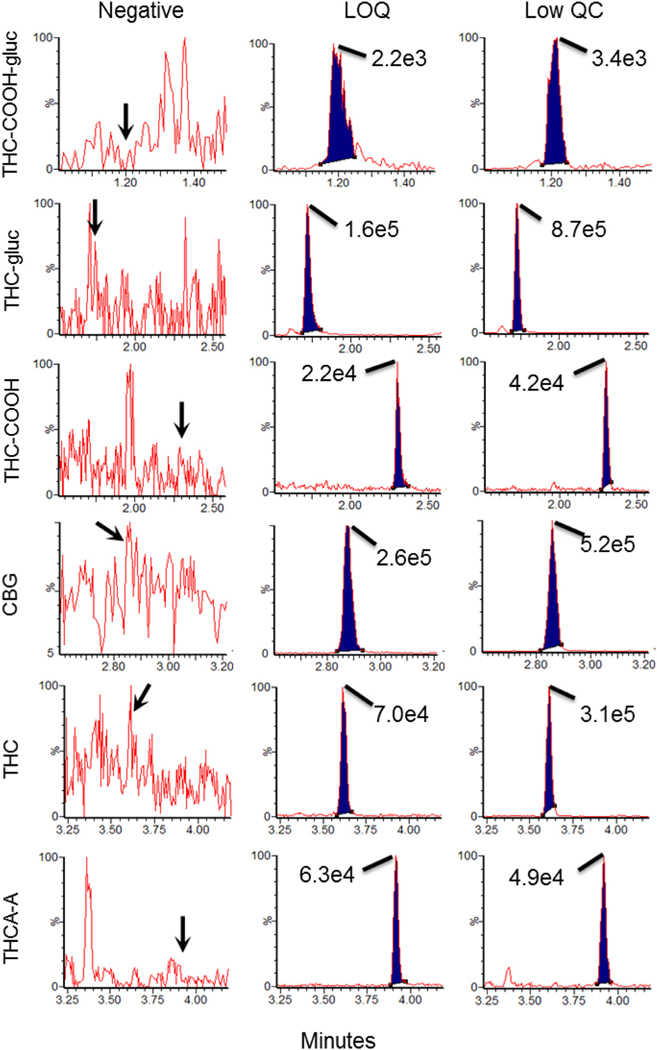
Fig. 2.
Representative chromatograms for the quantifier transitions for THC-COOH-gluc, THC-gluc, THC-COOH, CBG, THC, and THCA-A in authentic drug free oral sample (left column) and the same sample spiked with the low QC (right column). Middle column demonstrates the chromatography at the LLOQ for each compound displayed in synthetic oral fluid. Values in graph correspond to maximal peak height of each compound.

