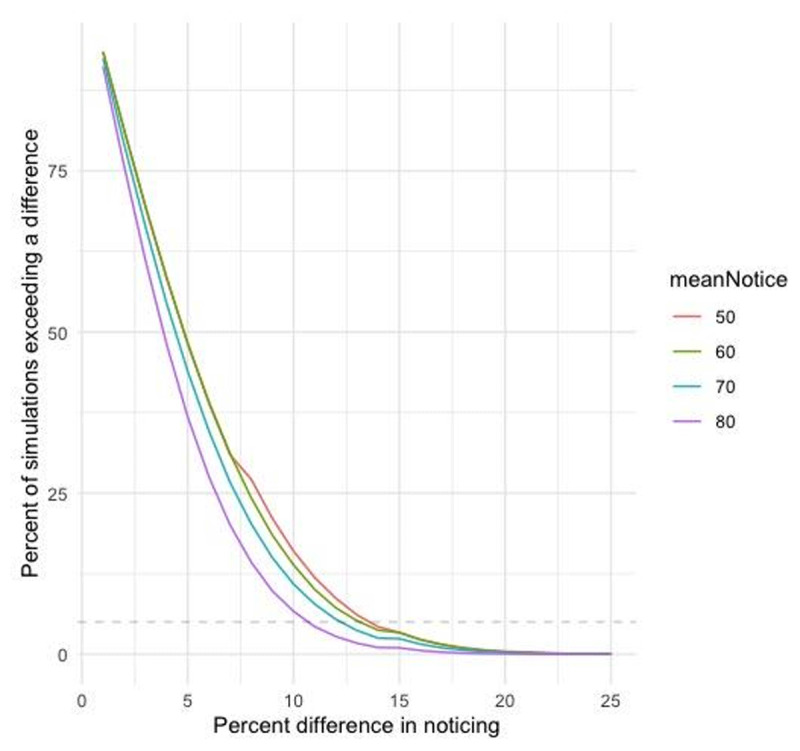
Figure 2.

Simulation illustrating the likelihood of differences in noticing rates of various magnitudes as a function of the mean noticing rate across the two groups (with no actual difference in noticing between the two groups). The horizontal dashed line is at 5%, so differences in noticing falling below that line would be expected less than 5% of the time if there actually were no differences between groups. The graph shows average noticing rates above 50%, but the pattern would be the same for averages less than 50% based on how far they fall from 50% (e.g., the results for an average of 40% would be the same as for an average of 60%).
