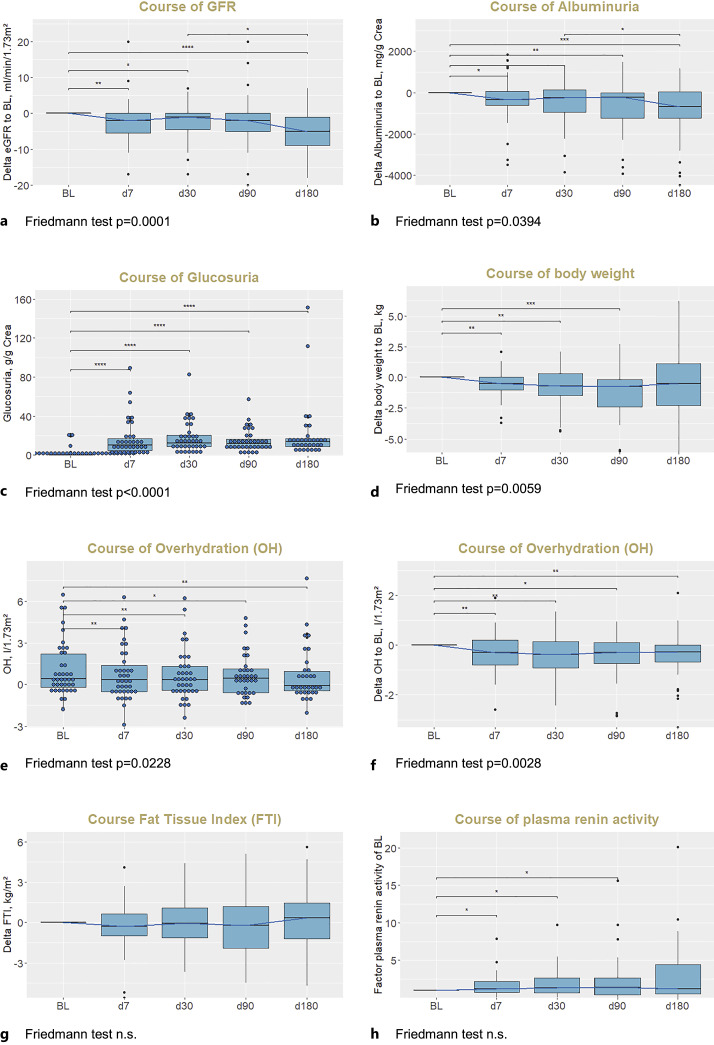
Fig. 2.
Course of GFR (a), albuminuria (b), glucosuria (absolute values, c), body weight (d), OH (absolute values, e, and delta values, f), FTI (g), and plasma renin activity (h). p values are from Wilcoxon tests, with Bonferroni correction for multiple testing: *p ≤ 0.05, **p ≤ 0.01, ***p ≤ 0.001, ****p ≤ 0.0001; ns, not significant. Note that the distances of x axis are not representative of FU time intervals. To correct for differences in available values at different FU time points, delta values normalized to the respective BL value are plotted. (e)GFR, (estimated) glomerular filtration rate calculated from plasma creatinine with CKD-EPI formula; BL, baseline, OH, overhydration; FTI, fat tissue index.

