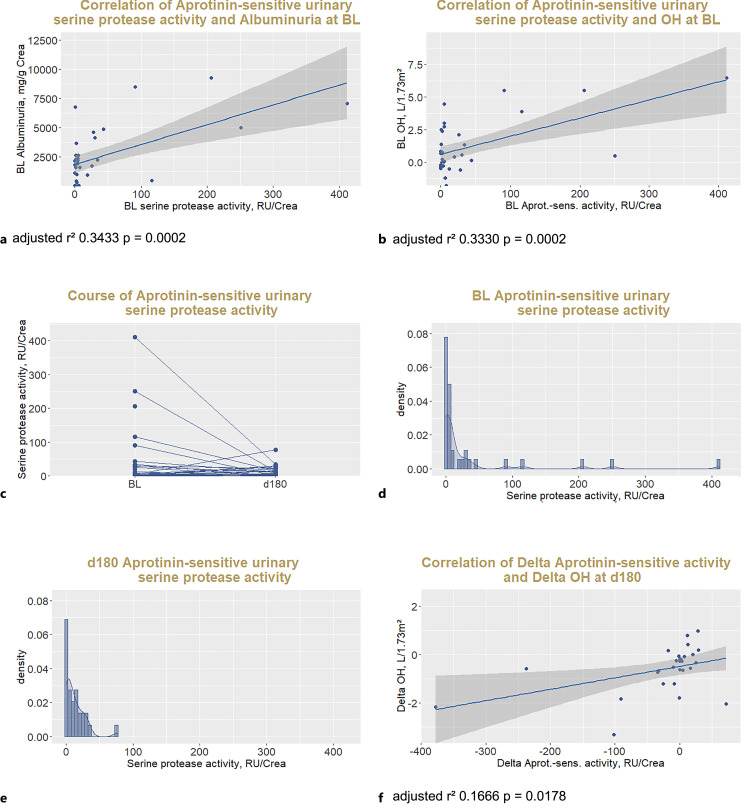
Fig. 4.
Effect of SGLT2 inhibitor treatment on proteasuria. Correlation of aprotinin-sensitive urinary serine protease activity with albuminuria (a) and OH (b) at BL, course of aprotinin-sensitive activity against the polybasic tract of g-ENaC represented by the substrate FTGRKR-AMC (c), histograms showing the distribution of urinary proteas activity at BL (d) and at 6 months (e), and correlation of delta aprotinin-sensitive urinary serine protease activity with delta OH after 6 months (f). BL, baseline; RU, relative units.

