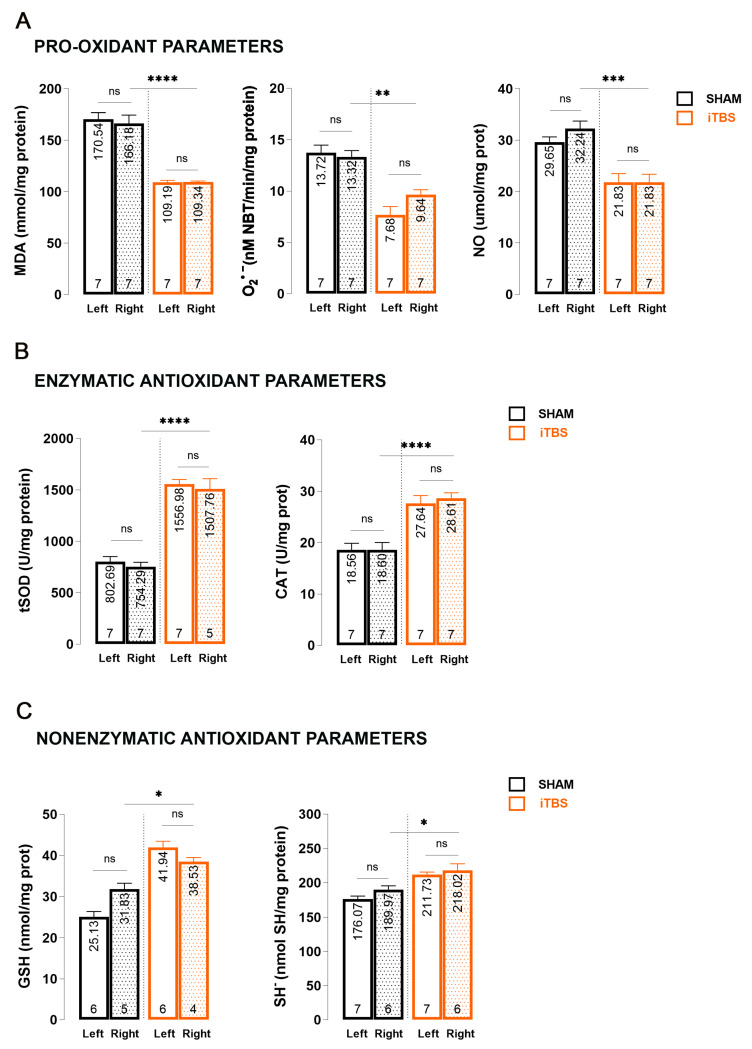
Figure 2.
Effects of prolonged iTBS treatment on oxidative balance in the caudoputamen of 6-OHDA-induced model of PD. Spectrophotometric analysis of pro-oxidative and enzymatic/non-enzymatic antioxidative parameters: (A) MDA, O2•−, NO; (B) total SOD, CAT; (C) GSH and SH− levels measured in caudoputamen homogenates (left and right hemisphere) from sham and iTBS animals after three weeks of stimulation. Bars shows mean activity expressed as U/mg protein or mol/mg protein. All data are presented as mean ± SD. Number in the bottom of the graphs represent number of individual animals included in analysis. Results of post hoc Tukey’s test and significance are shown inside graphs: ns–not significant, * p < 0.05, ** p < 0.01, *** p < 0.001, **** p < 0.0001.

