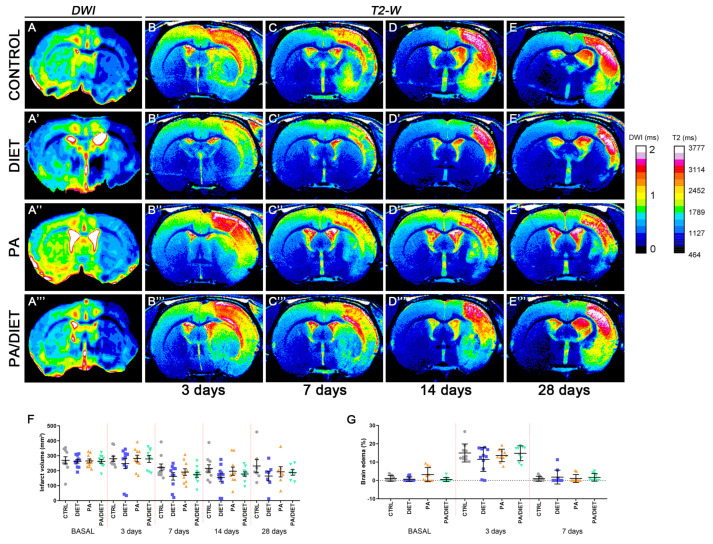
Figure 2.
Infarct size and edema development were assessed by means of magnetic resonance imaging (MRI) (A–E‴). T2-weighted images on each row correspond to one of the 2D slices of the same animals within each group at different time points: control rats (A–E), diet group (A′–E′), PA group (A″–E″), and PA/diet group (A‴–E‴). (F) Time course of infarct volumes. (G) Time course of the edema volumes. Bars show mean ± SEM. A total of 10 rats per group from basal to 14 days, and 7 rats per group at 28 days.

