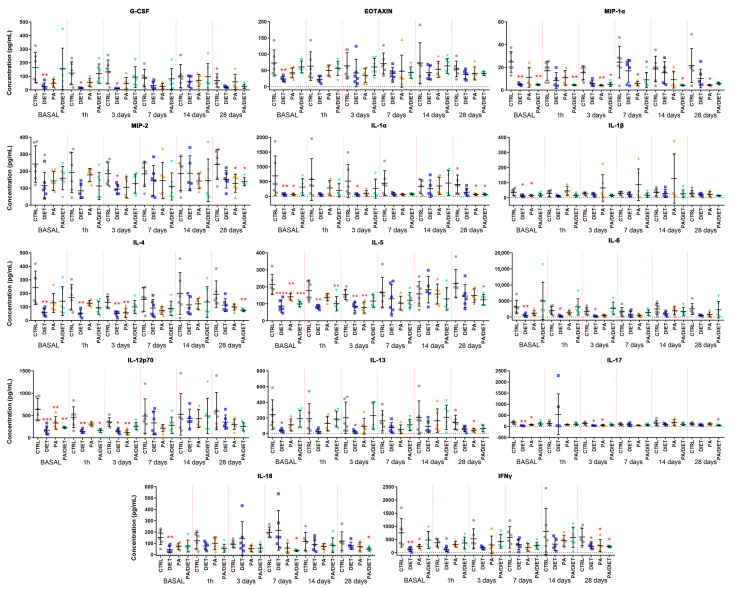
Figure 3.
Time course of plasma concentrations of fourteen cytokines/chemokines: granulocyte colony-stimulating factor (G-CSF); eotaxin; macrophage inflammatory protein (MIP)-1α; MIP-2; interleukin (IL)-1α; IL-1β; IL-4; IL-5; IL-6; IL-12p70; IL-13; IL-17; IL-18; and interferon-gamma (IFNγ) Comparisons were made at each time point vs. control and represented in the figure if significant. * < 0.05, ** < 0.01, *** < 0.001, **** < 0.0001. p values are shown in Table S1. Bars show mean ± SEM. A total of 6 rats per group.

