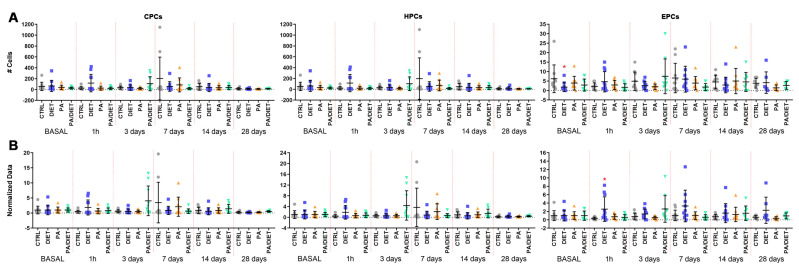
Figure 5.
(A) Time course of circulating progenitor cell (CPC), hematopoietic progenitor cell (HPC), and endothelial progenitor cell (EPC) numbers from blood samples (250.000 cells counted in each one. Stats at each time point are vs. control. Bars show mean ± SEM. (B) Time course of normalized data from (A) against control values at the basal point. Stats at each time point vs. control. * < 0.05. p values are shown in Table S2. Bars show mean ± SEM. A total of 10 rats per group from basal to 14 days, and 7 rats per group at 28 days.

