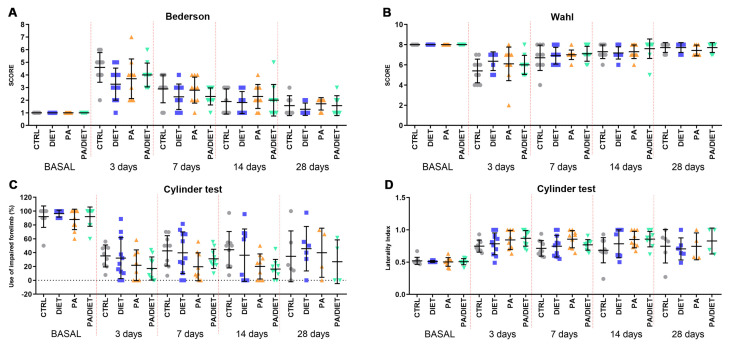
Figure 6.
Assessment of motor and neurological behavior by the Bederson test (A), the Wahl test (B), and the cylinder test, both asymmetry (C) and laterality (D). Stats at each time point are vs. control. Bars show mean ± SEM. 10 rats per each group from basal to 14 days, and 7 rats per each group at 28 days.

