Figure 8.
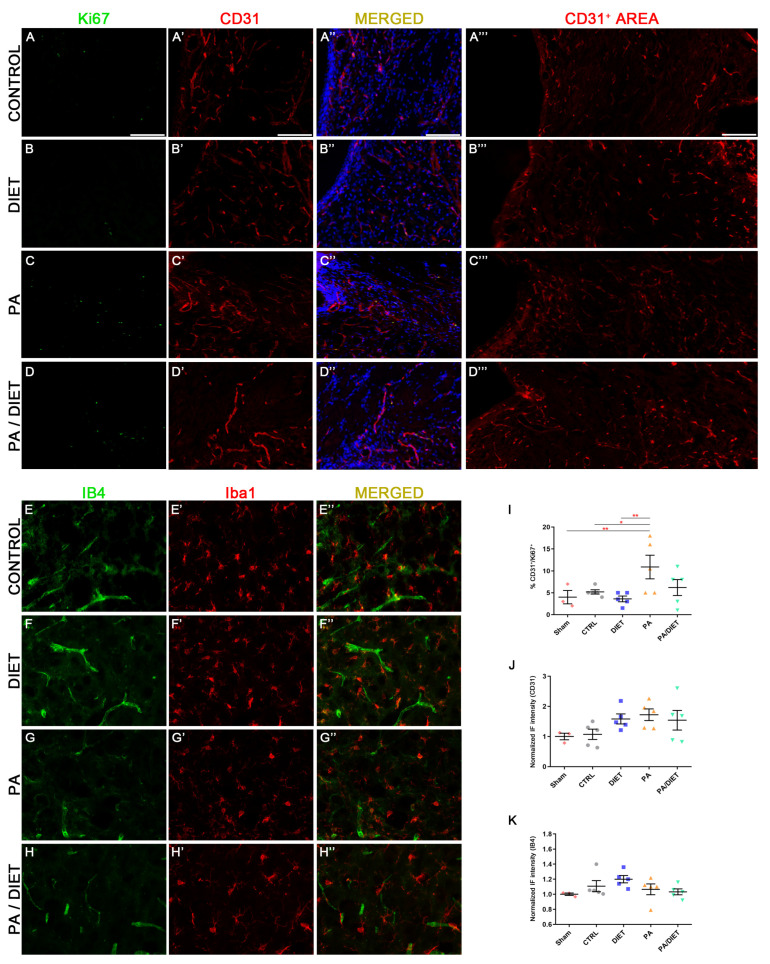
Representative images of Ki67 (A–D), CD31 (A′–D′), and CD31+ area (A‴–D‴) staining at the subventricular zone (SVZ) of the control group (A–A‴); diet group (B–B‴); PA group (C–C‴); and PA/diet group (D–D‴). Representative images of IB4 (E–H) and Iba1 (E′–H′) staining at the peri-infarct area in the sensorimotor cortex of the control group (E–E″); diet group (F–F″); PA group (G–G″); and PA/diet group (H–H″). (I) Quantification of the percentage (%) of CD31+ cells with Ki67 labeling from the total number of CD31+ cells, ** p = 0.0071 (PA vs. sham), * p = 0.0446 (PA vs. control), ** p = 0.0018 (PA vs. diet). (J) Quantification of CD31+ area immunoreactivity. (K) Quantification of IB4 immunoreactivity. Scale bars: 400 μm. Bars show mean ± SEM. A total of 3 sham rats and 5 rats per remaining group were used in all experiments, with 250 cells quantified per animal.

