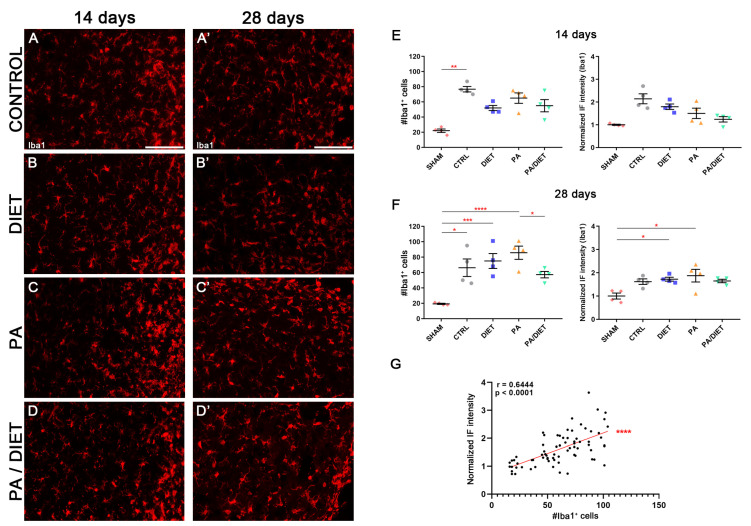
Figure 10.
Late microglia activation in either exercise or Mediterranean-like diet or combined groups following injury. Representative images of Iba1 staining at 14 days (A–D) and 28 days (A′–D′) following ischemia in the peri-infarct area of control, diet, PA, and PA/diet groups. (E) Quantifications of Iba1 immunoreactivity and the number of Iba1+ cells at 14 days after injury, ** p = 0.0096. (F) Quantifications of Iba1 immunoreactivity and the number of Iba1+ cells at 28 days after injury, Iba1+ cells: * p = 0.0114 (control vs. sham), *** p = 0.0005 (diet vs. sham), **** p < 0.0001 (PA vs. sham), * p = 0.0404 (PA vs. PA/diet); Iba1 immunoreactivity: * p = 0.0359 (diet vs. sham), * p = 0.012 (PA vs. sham). (G) Positive correlation for Iba1 immunofluorescence (IF) signal and the number of Iba1+ cells. Scale bars: 100 μm. Bars show mean ± SEM. A total of 4 rats were used per group.

