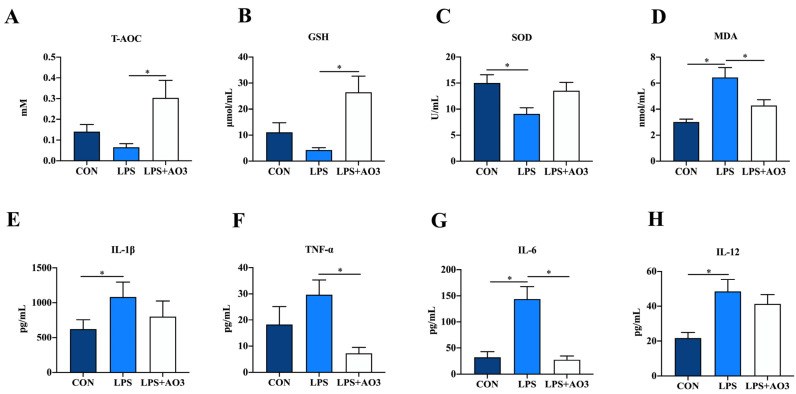
Figure 2.
Redox status and inflammatory factors in plasma. (A–D) Relative activities of T-AOC and SOD and relative concentrations of GSH and MDA in plasma. (E–H) Content of inflammatory cytokines (TNF-α, IL-1β, IL-6, IL-12) in plasma. Control (CON): a corn–soybean meal-based diet. LPS: CON diet, treatment with LPS. LPS+AO3: CON diet + 2000 mg/kg AO3, treatment with LPS. Data are expressed as mean ± SEM. * indicates p < 0.05. n = 18 total pigs, 6 replicates per group.

