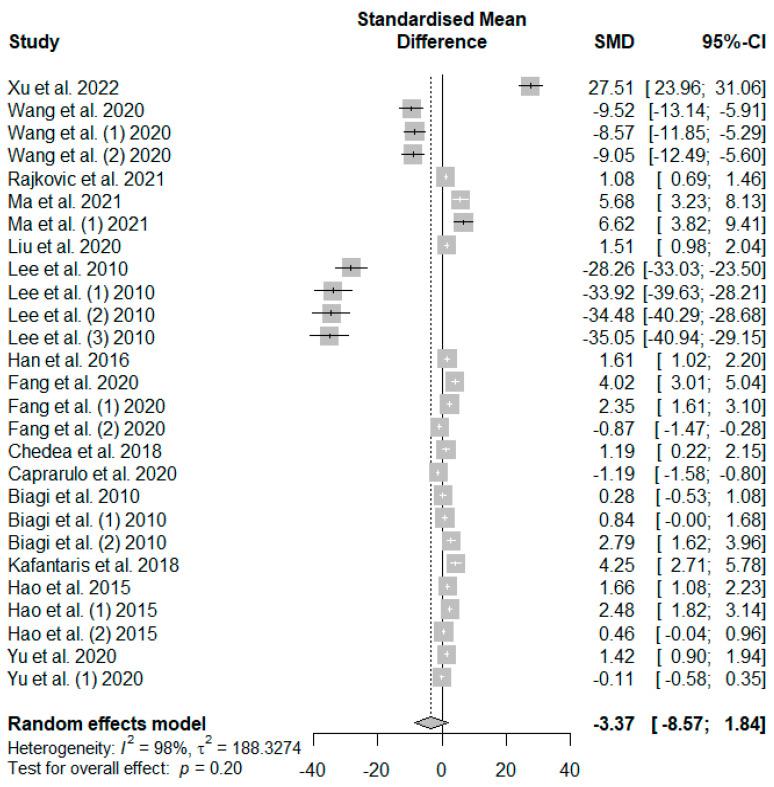
Figure 3.
Forest plot of the effect size or standardized mean difference and 95% confidence interval of tannins on weaned piglets’ average daily gain (ADG). The solid vertical black line represents the mean difference of zero or no effect. Points to the left of the solid vertical black line represent a reduction in ADG, while points to the right of the solid line indicate an increase in ADG.

