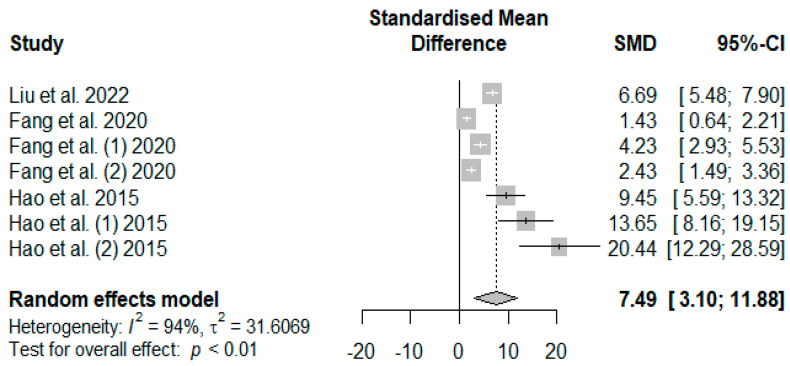
Figure 11.
Forest plot of the effect size or standardized mean difference and 95% confidence interval of tannins on weaned piglets’ serum total antioxidant capacity (T-AOC). The solid vertical black line represents the mean difference of zero or no effect. Points to the left of the solid vertical black line represent a reduction in T-AOC, while points to the right of the solid line indicate an increase in T-AOC.

