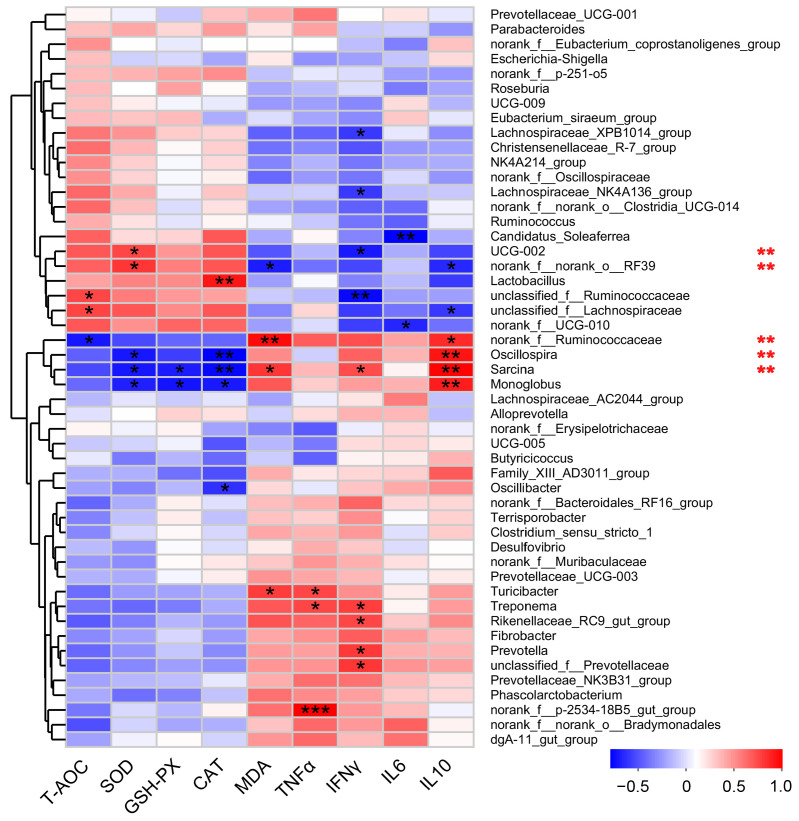
Figure 3.
Correlation between top 50 abundant gut microbiota and antioxidant ability and inflammatory factors in the sows based on Spearman coefficient. Red indicates a positive correlation, and blue indicates a negative correlation. The star symbol in the small square presents the correlation results. * p < 0.05, ** p < 0.01, *** p < 0.001; ** on the right of the picture represents significantly different microorganisms between control and malic acid group.

