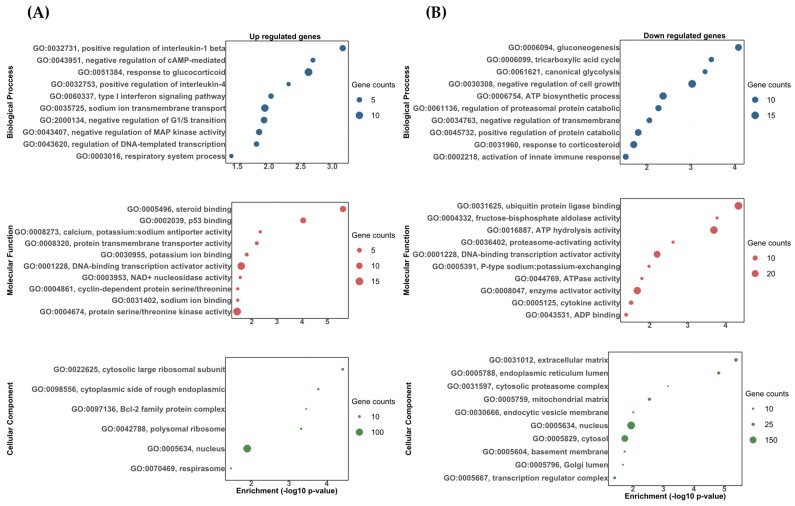
Figure 3.
The gene ontology biological process (BP), molecular function (MF), and cellular component (CC) enrichment of the DETs in the vehicle and DOC treatments. (A) Upregulated DETs. (B) Downregulated DETs. The graph indicates the −log10(p-value) that was enriched of the differentially expressed transcripts between the vehicle and DOC groups with a padj of <0.05.

