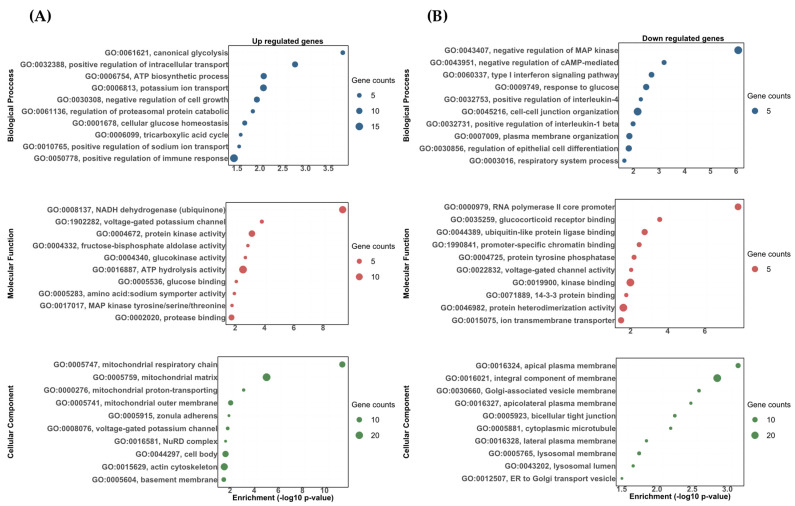
Figure 4.
The gene ontology biological process (BP), molecular function (MF), and cellular component (CC) enrichment of the differentially expressed transcripts between the DOC vs. eplerenone + DOC treatments. (A) Upregulated DETs. (B) Downregulated DETs. The graph indicates the −log10(p-value) that was enriched by the differentially expressed transcripts between the group DOC vs. eplerenone + DOC with a padj of <0.05.

