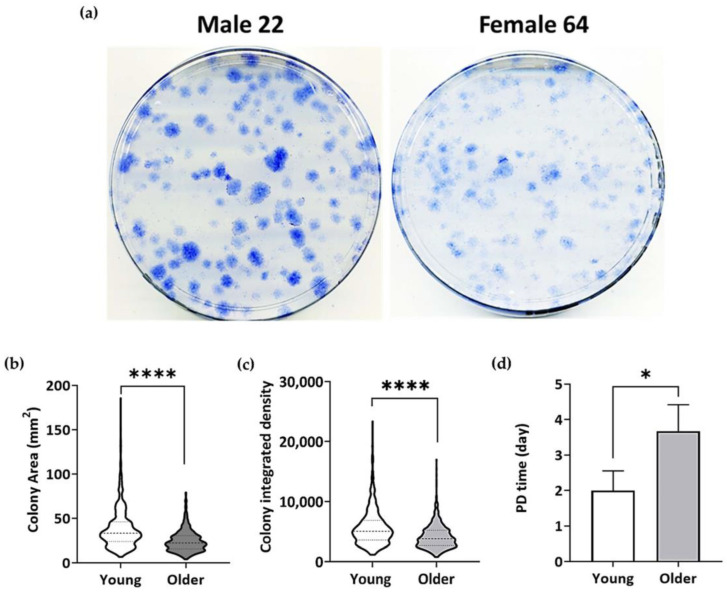
Figure 3.
Comparison of young and older donor BM-MSCs. (a) Representative images of methylene-blue-stained CFU-F plates. (b) Violin plots showing the colony area distribution and (c) colony-integrated density of the BM-MSCs of young (n = 3) and older donors (n = 3). Mann–Whitney test ****—p < 0.0001. Data shown as violin plots with median (dashed lines) and interquartile range (dotted lines) values of colony area and colony-integrated density. (d) PD time of young and older donor BM-MSCs. Unpaired t-test, two-tailed, *—p < 0.05. Data shown as mean ± standard deviation.

