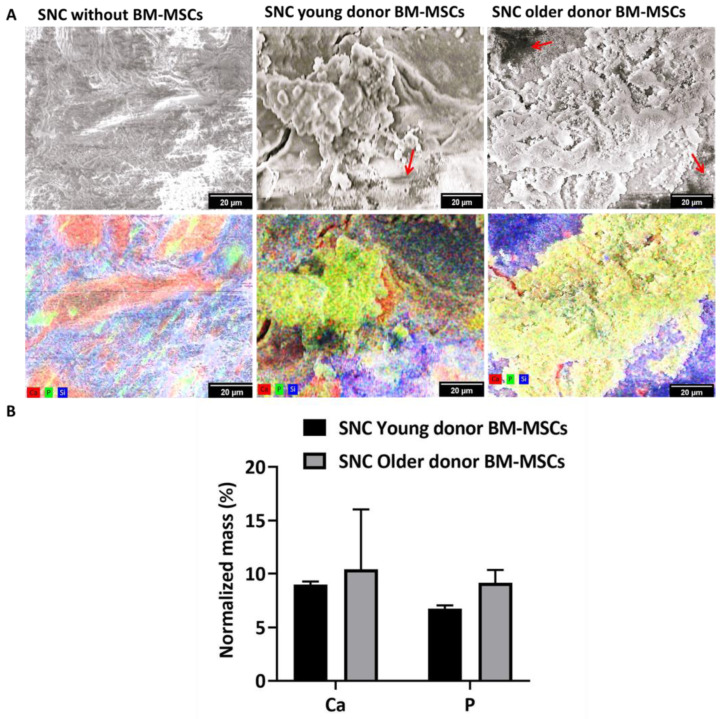
Figure 6.
In vitro mineralization of BM-MSCs seeded on SNC: (A) Representative SEM-EDS images of SNC without cells, SNC with pooled young donor BM-MSCs and SNC with pooled older donor BM-MSCs. The red arrow indicates the presence of cells. Each element measured was superimposed onto the SEM image using pseudo colour, calcium (red), phosphorous (green) or silicon (blue). The scale bar represents 20 µm; (B) Semi-quantitative analysis of the normalised mass (%) of calcium and phosphorus (n = 3 images from different replicates). Data shown as mean ± standard deviation.

